
Figures & data
Figure 1. Study design.
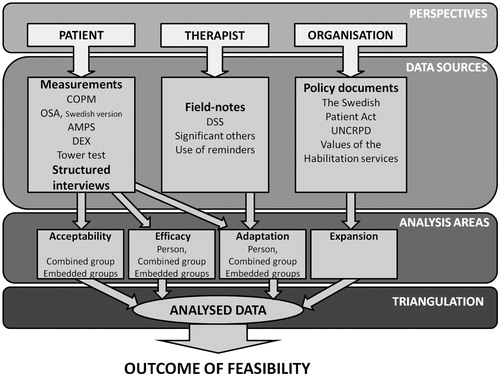
Table 1. Participants’ demographics.
Figure 2. Study timeline.
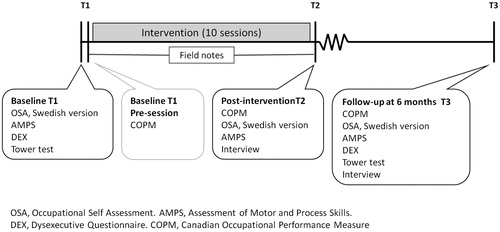
Table 2. Results: structured interviews.
Table 3. Results: proportions of change in outcome measures.
Table 4. Results: differences in goal attainment and body function, combined group.
Figure 3. Boxplots, Tower test, total achievement of scaled score, and composite group. A higher value represents better performance.
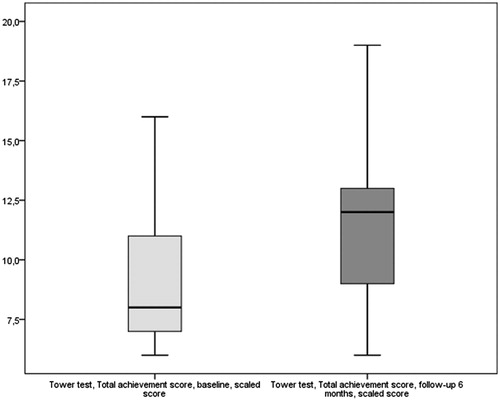
Table 5. Goals linked to international classification of functioning, disability, and health – child and youth version.