Figures & data
Figure 1. Flowchart of literature review process and results. Final analysis run on 5 July 2021. Search strings and further information are presented in the Supplementary material.
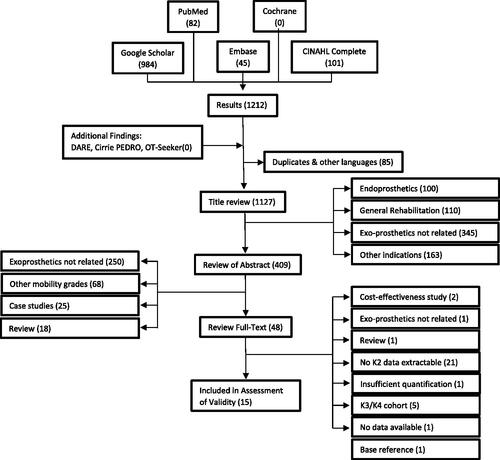
Table 1. Assessment of internal validity according to AAOP SoSc evidence report guidelines.
Table 2. Assessment of external validity and overall assessment assignment.
Table 3. Design and demographic data of the MG2 subgroup analyzed.
Table 4. Subgroup analysis for subjects with MCFL-2.
Table 5. Hafner et al. report on the MFCL-2 subgroup separately.
Table 6. Theeven et al. investigated the impact of C-Leg (CL) and C-Leg Compact (CPCT) on MCFL-2 subgroups with high, intermediate (int) and low activity level.
Table 7. As only relative differences were reported, TUG, ABC, and Houghton scores could not be utilized for the meta-analysis.
Table 8. Subgroup analysis on original data.
Table 9. Subgroup extracted from publication.
Table 10. Subgroup extracted from original data.
Table 11. The exploratory pilot study by Hasenoehrl et al. showed high heterogeneity of subjects’ baseline status and subsequent performance.
Table 12. Analysis from publication.
Table 13. The authors kindly provided their de-personalized data set for meta-analyses.
Table 14. Data extracted from original publication.
Table 15. Jayaraman et al. provide both groups with the same foot component.
Table 16. Davie-Smith et al. applied 18 times Bonferroni’s correction to significance level.
Figure 2. Results of meta-analysis of safety-related outcomes. (A) The number of falls presented as standardized mean difference between MPK and NMPK. (B) The fear of falling presented as standardized mean difference between MPK and NMPK. (C) The “timed up and go” completion time presented as standardized mean difference between MPK and NMPK.
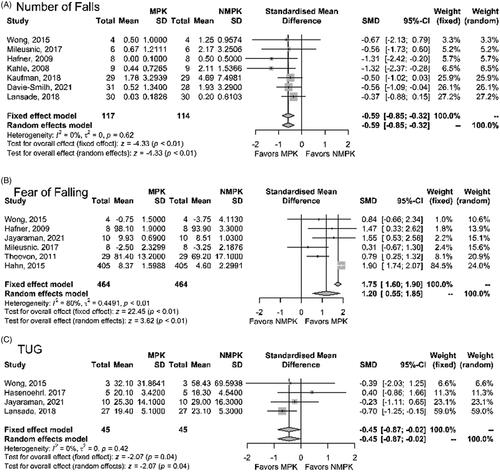
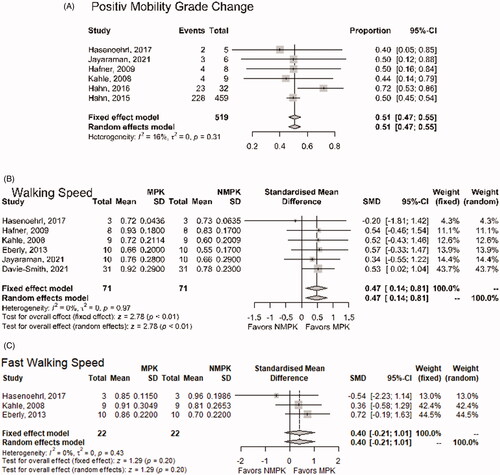
Figure 3. Results of meta-analysis of outcomes related to function, performance and mobility. (A) Change of mobility grade from 2 to 3 with MPK fitting. (B) Change in self-selected walking speed presented as standardized mean difference between MPK and NMPK. (C) Change in fastest possible walking speed presented as standardized mean difference between MPK and NMPK.