Figures & data
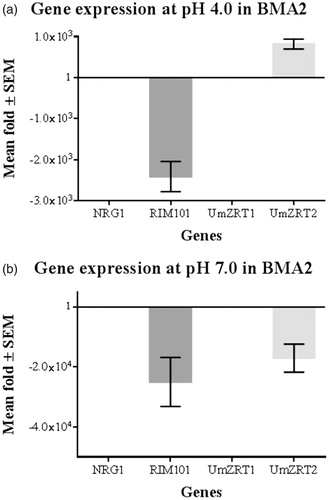
Figure 1. In silico prediction of UmZrt1p and UmZrt2p membrane topology. Both proteins a) UmZrt1 and b) UmZrt2 have eight predicted transmembrane domains (D1-D8) with the N- and C-terminal ends facing the extracellular space. The numbers shown in each domain correspond to the amino acids that make them up.
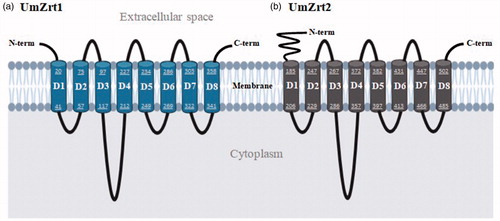
Figure 2. Functional domains predictions of UmZrt1p and UmZrt2. The length and functional domains of both proteins are shown in black and gray colors respectively.
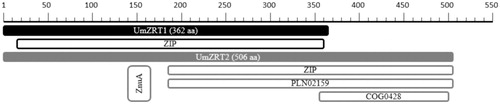
Figure 3. Amino acid sequence comparison of UmZrt1p and UmZrt2p. Percentage of identity shared by the Ustilago maydis proteins with Zrt/Irt-like proteins of yeast, plants and animals is shown.
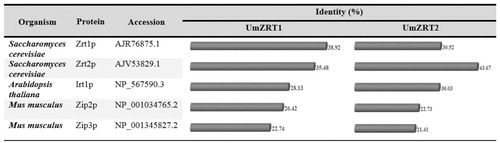
Figure 4. Complementation assays of ability to transport zinc in Saccharomyces cerevisiae cells expressing Ustilago maydis zinc transporters. a) ZHY3 (zrt1Δ zrt2Δ) cells were transformed with the pDR195 vector (negative control), pMC5 (positive control, S. cerevisiae ZRT1), pDR195-UmZRT1, and pDR195-UmZRT2. Each bar represents the mean of the triplicates of two biological experiments for each treatment and the statistical difference between treatments and the negative control is shown (*p < 0.05 and ****p < 0.0001). b) Yeast transformants described before (a) were inoculated onto LZM plates in drops containing 1 × 10⁵, 1 × 10⁴, 1 × 10³, and 1 × 10² cells. Panels i, ii, iii and iv correspond to LZM plus 1, 10, 100, 1000 µM ZnCl2, respectively.
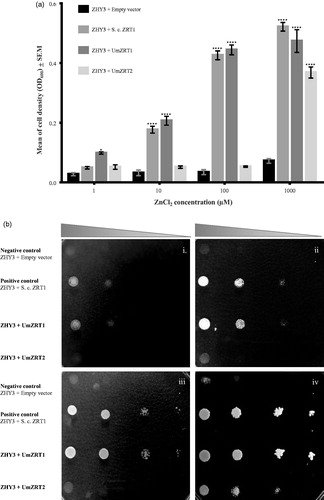
Figure 5. Quantification of zinc by ICP-OES. a) Determination of zinc abundance in dry weight of cells grown in YNB without zinc addition. b) Measure of zinc content in dry weight of cells grown in YNB supplemented with 1000 µM ZnCl2. Each bar represents the mean of the biological triplicates in each treatment and the statistical difference between FB1 and ZRT mutants is shown (**p < 0.01 and ***p < 0.001).
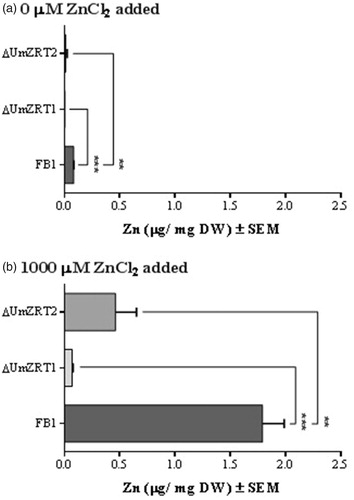
Figure 6. The effect of mutations in putative zinc transporters on growth of Ustilago maydis. a-d) correspond to YNB supplemented with 1, 10, 100 and 1000 µM of ZnCl2. Strains were spotted on the plates starting at OD600 = 0.5 followed by 10-fold serial dilutions.
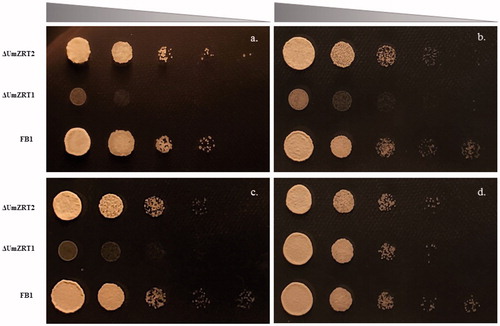
Table 1. Location of potential binding sites for transcription factors with possible regulatory functions in the U. maydis zinc transporter UmZRT1 and UmZRT2 promoter regions. Consensus binding sites for Nrg1p and Rim101p transcription factors in UmZRT1 and UmZRT2 promoters and their distance (bp) upstream relative of the ATG initiation codon.
Figure 7. Relative gene expression of BMA2 at acidic and neutral pH. Each bar represents the mean fold change (by Livak method) for triplicate measurements of two biological experiments corresponding to each gene in FB1 (calibrator) and BMA2 (ΔRIM101). The fold change of the control is 1 as a constant and data of the control are incorporated in the interest genes fold change. a) Fold differences in expression at pH 4.0 and low zinc concentrations in BMA2 compared with FB1. Repression effect of Rim101p on UmZRT2 is shown. b) Fold differences in expression at pH 7.0 and low zinc concentrations of BMA2. The activator effect of Rim101p on FB1 is exhibited, since BMA2 shows more than 1000 fold of repression at this condition.