Figures & data
Figure 1. Chemical structure of digitonin.
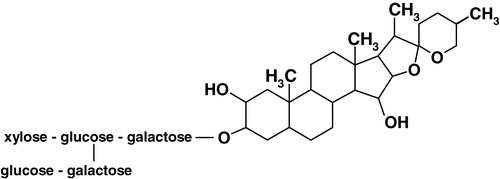
Figure 2. Cholesterol-complexing effect of digitonin. Total lipids extracted from digitonin-treated membranes were separated by thin layer chromatography as shown in (a). The lanes represent lipids extracted from native membranes (lane 2), and membranes treated with 0.6 mM (lane 3) and 1 mM (lane 4) digitonin. The arrow represents position of cholesterol on the thin layer chromatogram identified using a standard in lane 1. The total and freely available cholesterol content in digitonin-treated membranes were distinguished as shown in (b). The total cholesterol content (grey bars) in the lipid extract was determined by a densitometric analysis of the thin layer chromatogram. Values are expressed as a percentage of the cholesterol content in native membranes in the absence of digitonin. The amount of freely available cholesterol content (white bars) in membranes treated with digitonin was determined by the Amplex Red cholesterol assay kit. Values are expressed as a percentage of available cholesterol in native membranes in the absence of digitonin. Data represents the mean±SD of two independent experiments. See Materials and methods for further details.
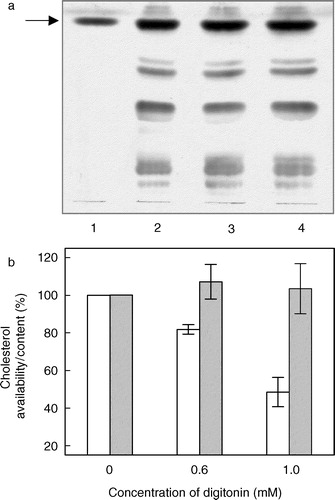
Figure 3. Effect of increasing concentrations of digitonin on the phospholipid content of bovine hippocampal membranes. Phospholipid contents were assayed as described in Materials and methods. Values are expressed as a percentage of the phospholipid content in native membranes in the absence of digitonin. Data represent the means±SE of three independent experiments.
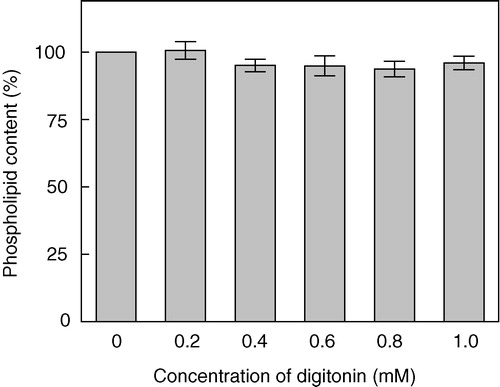
Figure 4. Effect of increasing concentrations of digitonin on specific [3H]8-OH-DPAT binding to the 5-HT1A receptor in hippocampal membranes. Values are expressed as a percentage of specific binding for native membranes in the absence of digitonin. Data shown are the means±SE of at least three independent experiments. See Materials and methods for other details.
![Figure 4. Effect of increasing concentrations of digitonin on specific [3H]8-OH-DPAT binding to the 5-HT1A receptor in hippocampal membranes. Values are expressed as a percentage of specific binding for native membranes in the absence of digitonin. Data shown are the means±SE of at least three independent experiments. See Materials and methods for other details.](/cms/asset/615b7520-53f7-4366-b2c1-1d4f72f5cf49/imbc_a_109328_uf0004_b.jpg)
Figure 5. Effect of increasing concentrations of digitonin on specific [3H]p-MPPF binding to the 5-HT1A receptor in hippocampal membranes. Values are expressed as a percentage of specific binding for native membranes in the absence of digitonin. Data shown are the means±SE of at least three independent experiments. See Materials and methods for other details.
![Figure 5. Effect of increasing concentrations of digitonin on specific [3H]p-MPPF binding to the 5-HT1A receptor in hippocampal membranes. Values are expressed as a percentage of specific binding for native membranes in the absence of digitonin. Data shown are the means±SE of at least three independent experiments. See Materials and methods for other details.](/cms/asset/8200cf41-4f5d-4db6-8246-335ce5ad4d2e/imbc_a_109328_uf0005_b.jpg)
Figure 6. Representative plots of fluorescence polarization as a function of optical density. The plots represent the fluorescence polarization of (a) DPH and (b) TMA-DPH for native membranes (○) which serve as control and 0.6 mM digitonin-treated membranes (•) upon dilution with 50 mM Tris, pH 7.4 buffer. Fluorescence polarization was calculated as described in Materials and methods at 23°C. The solid lines are linear fits to the data with the intercept on the ordinate (y-axis) considered as the corrected fluorescence polarization Citation[39]. The plots are data from at least three independent experiments. See Materials and methods for other details.
![Figure 6. Representative plots of fluorescence polarization as a function of optical density. The plots represent the fluorescence polarization of (a) DPH and (b) TMA-DPH for native membranes (○) which serve as control and 0.6 mM digitonin-treated membranes (•) upon dilution with 50 mM Tris, pH 7.4 buffer. Fluorescence polarization was calculated as described in Materials and methods at 23°C. The solid lines are linear fits to the data with the intercept on the ordinate (y-axis) considered as the corrected fluorescence polarization Citation[39]. The plots are data from at least three independent experiments. See Materials and methods for other details.](/cms/asset/2be9ee52-2c49-4936-9736-3bbe01f2f8d4/imbc_a_109328_uf0006_b.jpg)
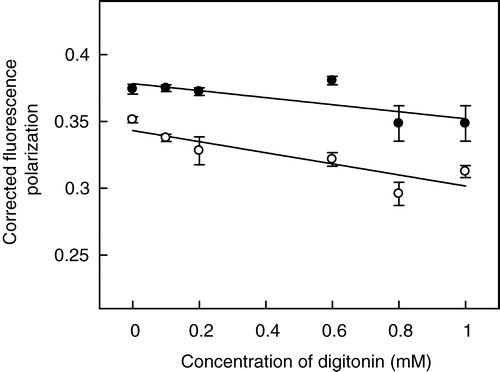
Figure 7. Effect of increasing concentrations of digitonin on fluorescence polarization of membrane probes DPH (○) and TMA-DPH (•) in hippocampal membranes. Fluorescence polarization experiments were carried out with membranes containing 50 nmol phospholipid at a probe to phospholipid ratio of 1:100 (mol/mol) at room temperature (23°C). The data show corrected fluorescence polarization values (as described in Materials and methods, and representative plots shown in ) and represent the means±SE of at least three independent experiments. The solid lines are linear fits of the data. See Materials and methods for other details.