Figures & data
Figure 1. Core concepts of the Damage-Fitness Model. (A) Error processes of normal biological activities in the absence of a stressor induce damage in healthy cells, tissues, and organs. This accrues with chronological age. In addition, stressors of endogenous or exogenous origin inflict damage to cells and the body. Organisms minimize persistent damage by avoiding the source of the stressor, damage repair, and damage removal. When the stressor or induced damage exceeds the capacity of the organism to minimize damage, persistent damage and dysregulation of physiological systems occur. Accumulation of the damage reduces fitness of an individual. (B) Due to error processes of biological activities, persistent damage increases with age (gray line). With increasing intensity, duration, and frequency of a stressor, persistent damage also increases (black line). These two types of damage are predicted to be additive.
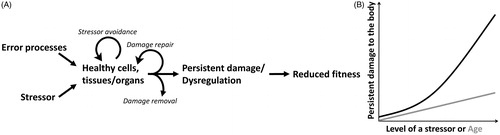
Figure 2. Relationships among anti-damage regulators, persistent damage and dysregulation of physiological systems, and fitness components/correlates. This figure may be considered a physiological explanation for an environmental change-fitness reaction norm presented in Monaghan (Citation2008). Anti-damage regulators are intricately connected to each other. Some of the connections are direct in that one physiological system directly influences another. Other connections are indirect through improving or reducing efficiency of another physiological system. Here, the networks of interconnected relationship between molecular/cellular and organismal anti-damage regulators are simplified as green vertical arrows between molecular/cellular and organismal anti-damage regulators (based on Physiological Regulatory Networks (Cohen, Martin, et al., Citation2012)). Anti-damage regulators are plastic and shaped by developmental environment and local and species adaptation through evolutoinary processes, while the strength of the stressor is in part determined by perception of the stressor. The purple arrow connecting organismal anti-damage regulators and fitness components depicts the relationship decribed in the Allostasis and Reactive Scope Models.
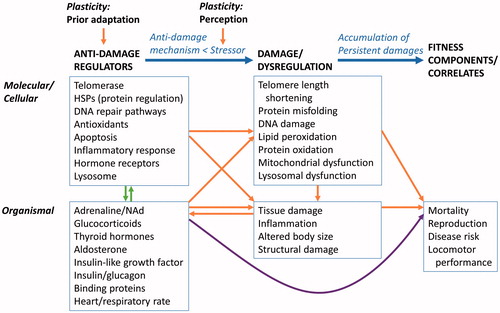
Figure 3. Predicted relationships between persistent damage and fitness-related measures (A) and the capacity of the anti-damage regulators and persistent damage (B). Persistent damage in these figures is a combination of damage caused by stressors as well as damage resulting from error processes of normal biological activities described in . (A) Vertical lines represent thresholds between low, moderate, and high cumulative damage with increasing impact of damage onto fitness-related measures. These thresholds depict stress tolerance. (B) Zone I refers to when a stressor level is lower than the capacity of the anti-damage regulators to evade damage. Zone II refers to when a level of the stressors exceeds the capacity of the regulators where persistent damage starts to accumulate. When a level of the stressors significantly exceeds the capacity of the regulators, persistent damage accumulates at a faster rate (Zone III). Past exposure to the stressor and appropriate regulators for the stressors present in the current environment likely expands the scope of stressor avoidance and damage repair, shifting the thresholds between zones toward the right. However, if the regulator phenotype does not match the occurring stressor, then the thresholds shift toward the left and faster accumulation of damage occurs.
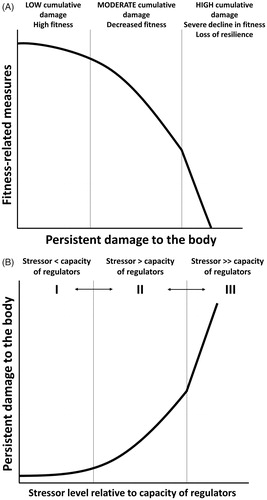
Figure 4. Predictors of fitness outcome based on an appropriateness of anti-damage regulators for the stressors present. Factors such as prior adaptation, life history stage, developmental environment, and current environment influence threshold, magnitude, and categories of anti-damage regulators as well as resulting cellular action (expanded in ). When the predetermined anti-damage regulator phenotype is appropriate for challenges present in the current environment, fitness is expected to increase. If the anti-damage regulator phenotype is not appropriate for the current environment, fitness is predicted to decline.
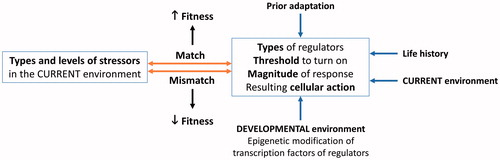
Table 1. Roles of adrenaline, noradrenaline, corticotropin releasing hormone (CRH), glucocorticoids, and aldosterone in avoiding, repairing/recovering from damage, or when these mechanisms have failed and persistent damage and dysregulation occur.
Table 2. Anti-damage mechanisms minimizing mitochondrial DNA (mtDNA) damage and its consequences when damage could not be avoided, repaired, or removed.
Figure 5. Predicted relationship between developmental stressor intensity and fitness-related measures when the adult environment is stressful (A) and when the adult environment is benign (B). Arrows represent treatment groups in an experiment, control and developmentally stressed groups, in relation to fitness-related measures.
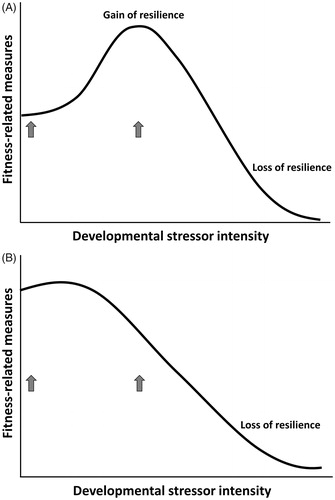
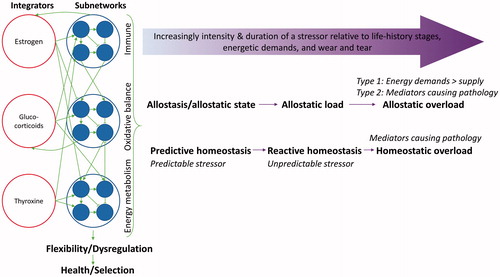
Figure 6. Schematic representation of Allostasis and Reactive Scope Models (horizontal purple arrows) and Physiological Regulatory Networks (green arrows among integrators, subnetworks, flexibility/dysregulation, and health/selection; redrawn from Cohen et al., Citation2012). Allostasis and Reactive Scope Models describe the temporal change of a particular physiological mediator, while Physiological Regulatory Networks describes integration of physiological systems within an individual that response together to a stressor. Wear and tear move the threshold of homeostatic overload closer to Reactive Homeostasis.