25,056
Views
470
CrossRef citations to date
0
Altmetric
Research Article

Review of the Toxicology of Chlorpyrifos With an Emphasis on Human Exposure and Neurodevelopment

, , , , , , , , , , , & show all
Pages 1-125 | Published online: 21 Oct 2008

Figures & data

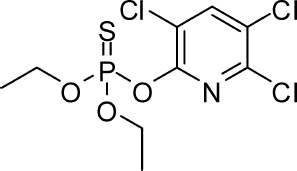
FIG. 1 Chemical structure of chlorpyrifos.

FIG. 1  Chemical structure of chlorpyrifos.

TABLE 1 Formulations containing chlorpyrifos and alternate chemical names

TABLE 2 Chlopyrifos—Physical/chemical properties

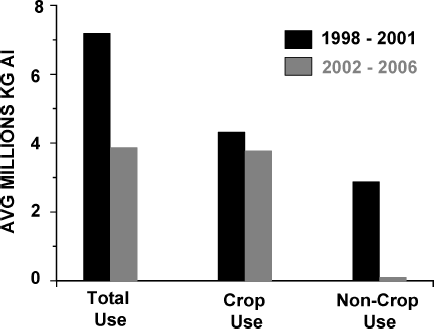
FIG. 2 Distribution of chlorpyrifos uses before and after the restriction of indoor application. (Data provided by Dow AgroSciences.)

FIG. 2  Distribution of chlorpyrifos uses before and after the restriction of indoor application. (Data provided by Dow AgroSciences.)

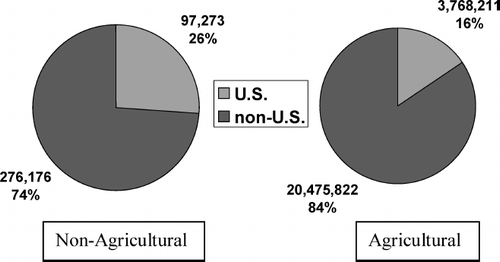
FIG. 3 U.S. Share in global agricultural and non-agricultural uses of chlorpyrifos from 2002–2006. Values are given as annual averages, in kg active ingredient (Data provided by Dow AgroSciences.)

FIG. 3  U.S. Share in global agricultural and non-agricultural uses of chlorpyrifos from 2002–2006. Values are given as annual averages, in kg active ingredient (Data provided by Dow AgroSciences.)

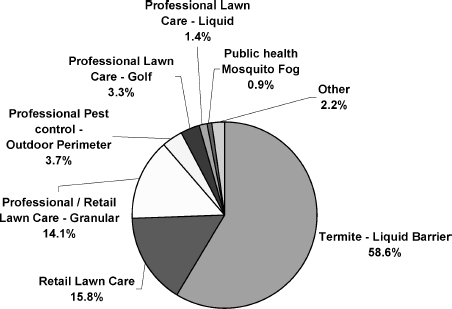
FIG. 4 Former use of chlorpyrifos in nonagricultural settings in the U.S. during the period of 1998–2001, i.e., prior to restriction of home use. (Data provided by Dow AgroSciences.)

FIG. 4  Former use of chlorpyrifos in nonagricultural settings in the U.S. during the period of 1998–2001, i.e., prior to restriction of home use. (Data provided by Dow AgroSciences.)

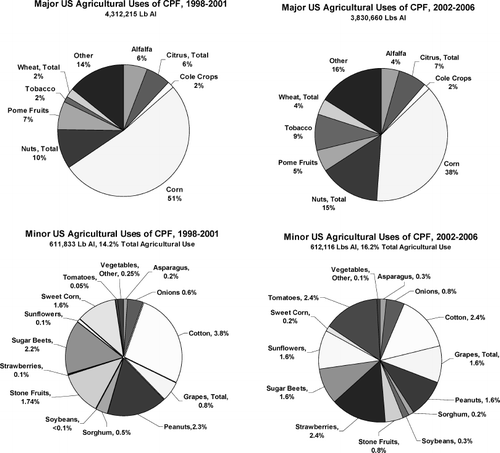
FIG. 5 Percentage of agriculturally applied chlorpyrifos used on crops in the United States. during 1998–2001 (left) and 2002–2006 (right). Major use crops are shown on the top, and minor use crops are shown on the bottom. (Data provided by Dow AgroSciences.)

FIG. 5  Percentage of agriculturally applied chlorpyrifos used on crops in the United States. during 1998–2001 (left) and 2002–2006 (right). Major use crops are shown on the top, and minor use crops are shown on the bottom. (Data provided by Dow AgroSciences.)

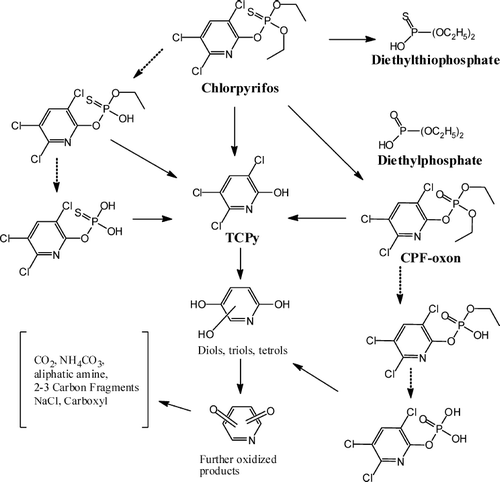
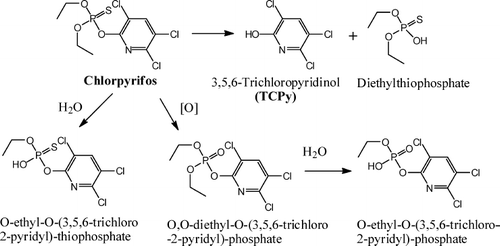
FIG. 6 Degradation pathways for chlorpyrifos. Dashed arrows show theoretical metabolites that have not been rigorously identified as environmental degradation products.

FIG. 6  Degradation pathways for chlorpyrifos. Dashed arrows show theoretical metabolites that have not been rigorously identified as environmental degradation products.

FIG. 7 Environmental degradation pathways of chloropyrifos.

FIG. 7  Environmental degradation pathways of chloropyrifos.

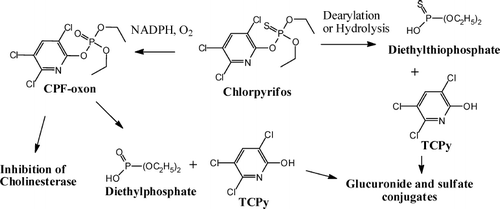
FIG. 8 Biotransformation of chlorpyrifos.

FIG. 8  Biotransformation of chlorpyrifos.

TABLE 3 Theoretical human brain chlorpyrifos-oxon levels utilizing Monte Carlo simulation for the QQ, QR, and RR PON1 polymorphism following a single exposure to different doses of chlorpyrifos

TABLE 4 Acute oral LD50 values in different species

TABLE 5 Summary of genotoxicity studies with TCPy (from CitationDow, 2002)

TABLE 6 Controlled primate studies: Single dose and repeated dose

TABLE 7 Summary of reports of the effects of uncontrolled exposures to chlorpyrifos

TABLE 8 In vivo developmental neurotoxicity studies with chlorpyrifos (Chambers et al.)

TABLE 9 In vivo developmental neurotoxicity studies with chlorpyrifos (Pope et al.)

TABLE 10 In vivo developmental neurotoxicity studies with chlorpyrifos (Abou-Donia et al.)

TABLE 11 In vivo studies with chlorpyrifos (1 mg/kg-day on PND 1–4) (Slotkin et al.)

TABLE 12 In vivo studies with chlorpyrifos (5 mg/kg-day on PND 11–14) (Slotkin et al.)

TABLE 13 Summary of studies on effects of prenatal exposures to chlorpyrifos PND 17–20 (Slotkin et al.)

TABLE 14 Summary of in vitro effects of chlorpyrifos and chlorpyrifos metabolites

TABLE 15 Major cohort studies on chlorpyrifos, with summary of authors' reported finding

TABLE 16 Summary of mean chlorpyrifos concentration in air and blood of Columbia cohort maternal–child pairs

TABLE 17 Urinary TCPy Concentrations (μ ug/L, or ppb)

TABLE 19 Chlorpyrifos in source media—Soil, Housedust and food [mean, SD; (maximum or range)]

TABLE 18 Chlorpyrifos in source media–air, ng/m3 [mean (SD/range; maximum)]

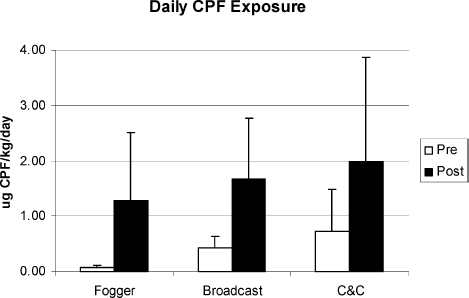
FIG. 9 Pre-versus postapplication exposure to chlorpyrifos from residential use (from Kreiger et al., 2001).

FIG. 9  Pre-versus postapplication exposure to chlorpyrifos from residential use (from Kreiger et al., 2001).

TABLE 20 Summary statistics for chlorpyrifos and chlorpyrifos-methyl residues in foods, FDA Total Diet Study, 1991–2003

TABLE 21 Estimates of daily chlorpyrifos/chlorpyrifos-methyl intake based on food intake rates and residue concentrations

TABLE 22 Urinary TCPy concentrations in children consuming conventional and “certified organic” diet (from CitationLu et al., 2006)

TABLE 23 Variability in urinary TCPy at different times of sample collection (from CitationKissel et al., 2005)

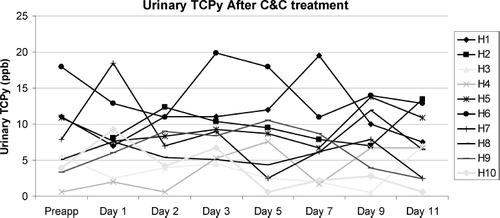
FIG. 10 Urinary TCPy concentrations in children following Crack and Crevice treatment of homes with chlorpyrifos. Data from CitationHore et al. (2005).

FIG. 10  Urinary TCPy concentrations in children following Crack and Crevice treatment of homes with chlorpyrifos. Data from CitationHore et al. (2005).

TABLE 24 Comparison of exposure parameters for three epidemiology cohort studies evaluating potential neurodevelopmental effects of chlorpyrifos
Reprints and Corporate Permissions

Please note: Selecting permissions does not provide access to the full text of the article, please see our help page How do I view content?

To request a reprint or corporate permissions for this article, please click on the relevant link below:

Academic Permissions

Please note: Selecting permissions does not provide access to the full text of the article, please see our help page How do I view content?

Obtain permissions instantly via Rightslink by clicking on the button below:

If you are unable to obtain permissions via Rightslink, please complete and submit this Permissions form. For more information, please visit our Permissions help page.