
Figures & data
Figure 1. Chemical structure of triclosan.
Table 1. Ranked endpoints for relevant triclosan data for the estrogen agonist hypothesis.
Table 2. Ranked endpoints for relevant triclosan data for the estrogen antagonist hypothesis.
Table 3. Ranked endpoints for relevant triclosan data for the androgen agonist hypothesis.
Table 4. Ranked endpoints for relevant triclosan data for the androgen antagonist hypothesis.
Table 5. Ranked endpoints for relevant triclosan data for the thyroid agonist hypothesis.
Table 6. Ranked endpoints for relevant triclosan data for the thyroid antagonist hypothesis.
Table 7. Ranked endpoints for relevant triclosan data for the steroidogenesis induction hypothesis.
Table 8. Ranked endpoints for relevant triclosan data for the steroidogenesis inhibition hypothesis.
Figure 2. ToxCast concentration distribution for assays active for triclosan. The endocrine-specific receptor assays are estrogen (ER), androgen (AR), thyroid (ThR), and aromatase. The solid line represents the median cytotoxicity limit and the dashed line is the lower bound (5%) cytotoxicity limit.
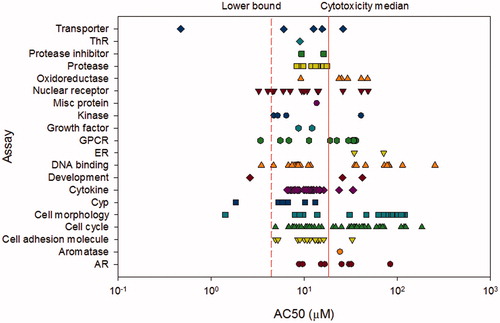
Table 9. Histopathological examination of thyroid in repeat dose studies with various species, duration, and route of exposure to triclosan.