
Figures & data
Figure 1. RISK21 tiered exposure assessment framework in the context of the RISK21 framework.
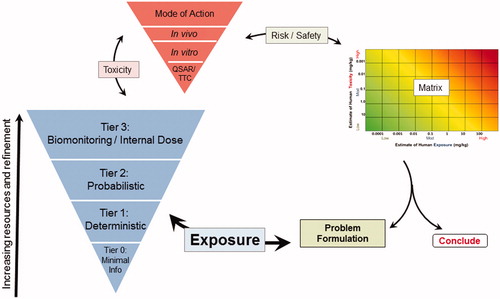
Table 1. Description of exposure tiers and examples of corresponding tools/models/data.
Figure 2. Risk assessment matrix. Coloring indicates gradations of risk potential, from exposure being much lower than the hazard benchmark level (dark green, bottom left, including estimate (A) to exposure exceeding the hazard benchmark level (dark red, upper right, including estimate (B1). Estimate B2 illustrates a refinement of both exposure and toxicity that results in a range that is lower than the hazard benchmark.
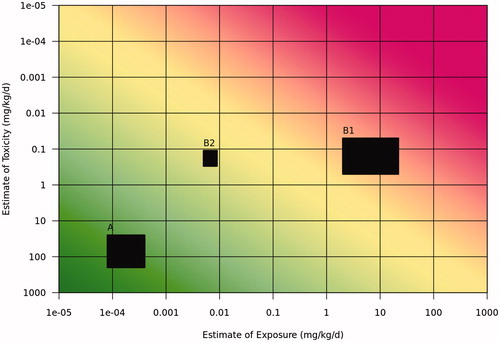
Table 2. Industrial worker exposure look-up table from ECETOC TRA v.3.1 Model.
Table 2. Continued.
Table 3. Professional worker exposure look-up table from ECETOC TRA v.3.1 model.
Table 3. Continued.
Box 1. Tier 0 exposure assessment – worker look-up table example procedures.
Figure 3. Consumer exposure estimation for products at low vapor pressure derived from EGRET tool.
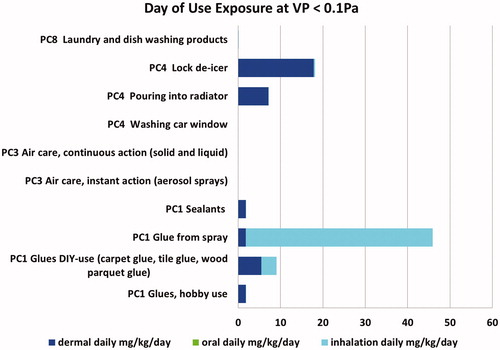
Table 4. Tier 0 consumer exposure (ECETOC TRA v.3), acute (day of use) exposure estimates by vapor pressure.
Table 5. Tier 0 consumer exposure (EGRET) predictions, acute (day of use) exposure estimates from EGRET by vapor pressure.
Box 2. Tier 0 exposure assessment – consumer look-up table procedures.
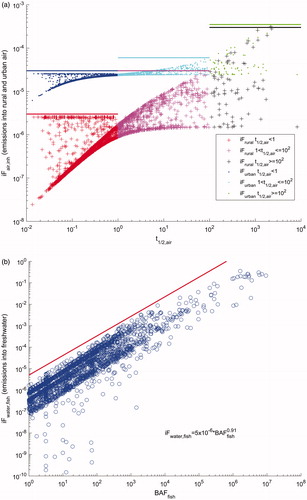
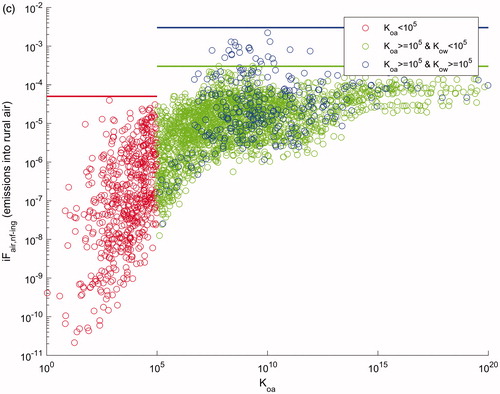
Table 6. (a) Upper limits for intake fraction and (b) high-end exposure and variability factors, per environmental exposure pathway.
Table 7. Summary of monitoring databases.
Table 8. Physicochemical properties for deltamethrin.
Figure 5. Tier 0 risk assessment matrix comparison of toxicity with exposure estimates for the case study for (A) adult worker, (B) child camper (consumer), (C) adult community resident indirectly exposure via the environment based on solubility, and (D) adult community resident based on banded intake fraction. The uncertainties represented by the boxes include 100× toxicity for the adult scenarios, 300x toxicity for child camper, 100× exposure for adult worker and child camper, and 256× exposure (16× in each direction) for the adult community resident based on solubility. For adult community resident based on banded intake fraction, the calculated range incorporated exposure uncertainty.
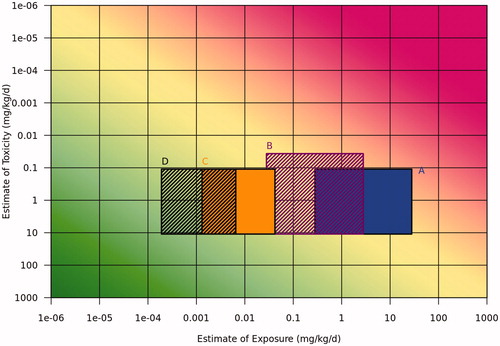
Table 9. Comparison of Tier 0 exposure estimates.
Table 10. Tier 1 worker scenario refinements.
Table 11. Reference values from WHO (Citation2004) generic risk assessment.
Figure 6. Tier 1 risk assessment matrix representing risk in the case study for (A) adult worker, (B) child camper (consumer), and (C) adult community resident exposed via the environment. The uncertainties represented by the boxes include 100× toxicity for the adult scenarios, 300× toxicity for child camper, and 30x exposure for adult worker and child camper. For adult community resident, the calculated range incorporated uncertainty.
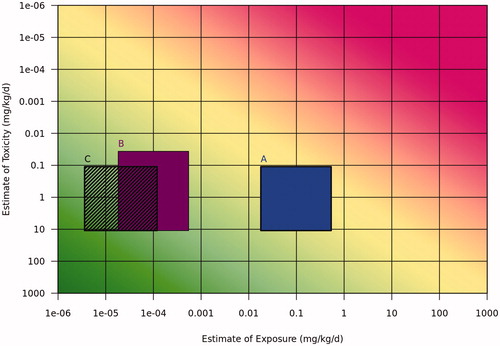
Table 12. Results of Tier 1 exposure estimates.