Figures & data
Figure 1. Summary of WoE for the updated responses for the effects of atrazine on fish, amphibians and reptiles (redrawn with data from Figure 35 in Van Der Kraak et al., Citation2014). The symbols are means and the error bars are 2 × SE of the mean (reproduced with permission).
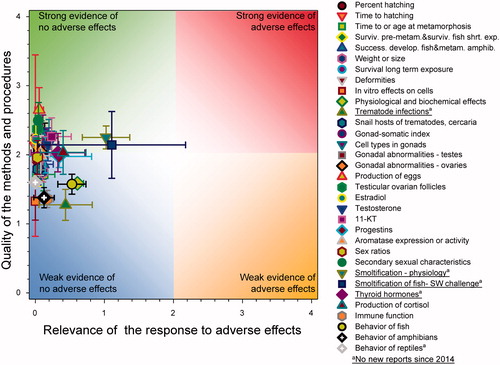
Figure 2. WoE analysis of the effects of atrazine on hatching in fish, amphibians, and reptiles. Redrawn with data from Van Der Kraak et al. (Citation2014) with new data added and included in the mean and 2 × SE of the scores. Data points from the new studies are shown as large squares while the data points from the previous studies are shown as small circles. Number of responses assessed = 36. Symbols may obscure others, see SI for this paper and Van Der Kraak et al. (Citation2014) for all responses. No data points were obscured by the legend.
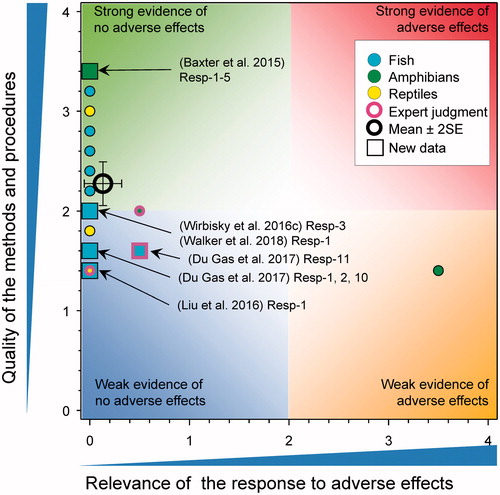
Figure 3. WoE analysis of the effects of atrazine on time to hatching in amphibians in fish, amphibians, and reptiles. Redrawn with data from Van Der Kraak et al. (Citation2014) with new data added and included in the mean and 2 × SE of the scores. Number of responses assessed = 3. Symbols may obscure others, see SI for this paper and Van Der Kraak et al. (Citation2014) for all responses. No data points were obscured by the legend.
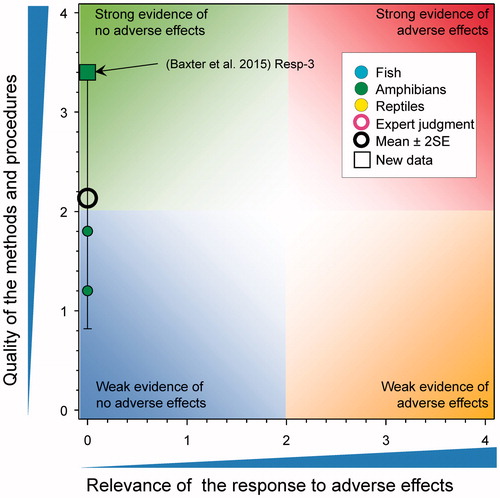
Figure 4. WoE analysis of the effects of atrazine on time to time to, or age at metamorphosis in amphibians or time to hatch in reptiles. Redrawn with data from Van Der Kraak et al. (Citation2014) with new data added and included in the mean and 2 × SE of the scores. Number of responses assessed = 39. Symbols may obscure others, see SI for this paper and Van Der Kraak et al. (Citation2014) for all responses. No data points were obscured by the legend.
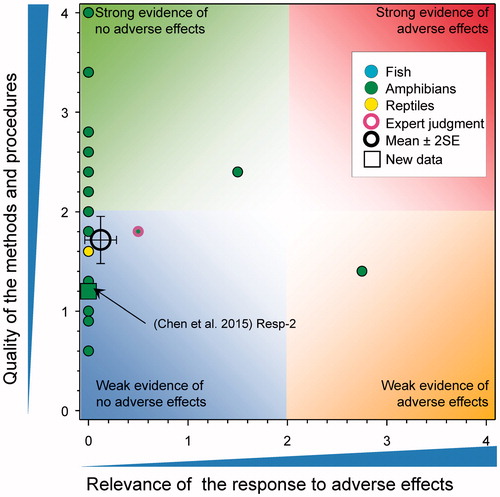
Figure 5. WoE analysis of the effects of atrazine on survival of fish, amphibians, and reptiles after short-term exposures. Redrawn with data from Van Der Kraak et al. (Citation2014) with new data added and included in the mean and 2 × SE of the scores. Number of responses assessed = 157. Symbols may obscure others, see SI for this paper and Van Der Kraak et al. (Citation2014) for all responses. No data points were obscured by the legend.
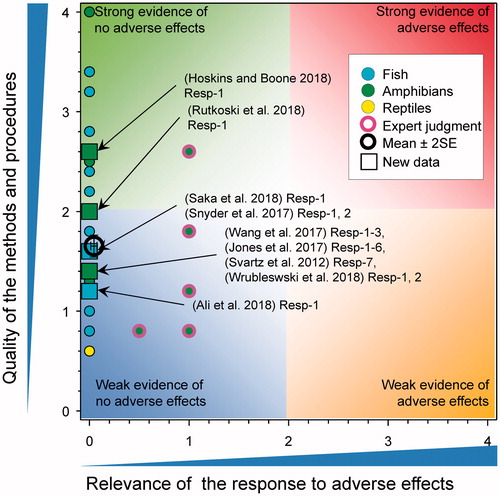
Figure 6. WoE analysis of the effects of atrazine on survival of fish, amphibians, and reptiles after long-term exposures. Redrawn with data from Van Der Kraak et al. (Citation2014) with new data added and included in the mean and 2 × SE of the scores. Number of responses assessed = 36. Symbols may obscure others, see SI for this paper and Van Der Kraak et al. (Citation2014) for all responses. No data points were obscured by the legend.
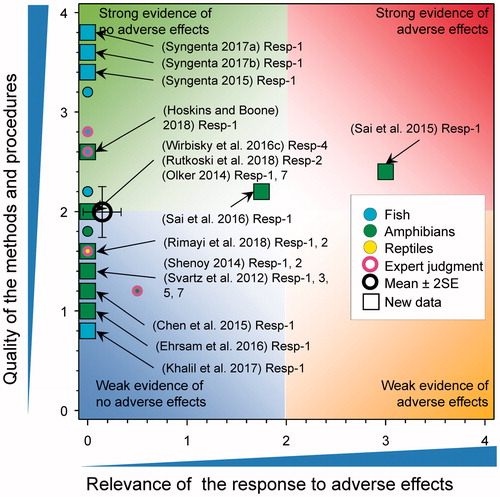
Figure 7. WoE analysis of the effects of atrazine on successful development in fish and metamorphosis in amphibians. Redrawn with data from Van Der Kraak et al. (Citation2014) with new data added and included in the mean and 2 × SE of the scores. Number of responses assessed = 41. Symbols may obscure others, see SI for this paper and Van Der Kraak et al. (Citation2014) for all responses. No data points were obscured by the legend.
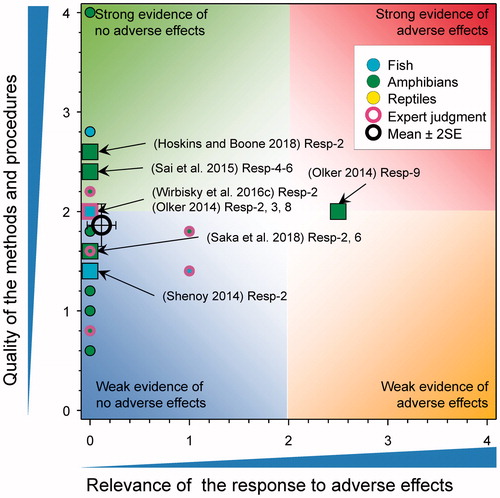
Figure 8. WoE analysis of the effects of atrazine on weight or size of fish, amphibians and reptiles. Redrawn with data from Van Der Kraak et al. (Citation2014) with new data added and included in the mean and 2 × SE of the scores. Number of responses assessed = 148. Symbols may obscure others, see Sl for this paper and Van Der Kraak et al., Citation2014 for all responses. No data points were obscured by the legend.
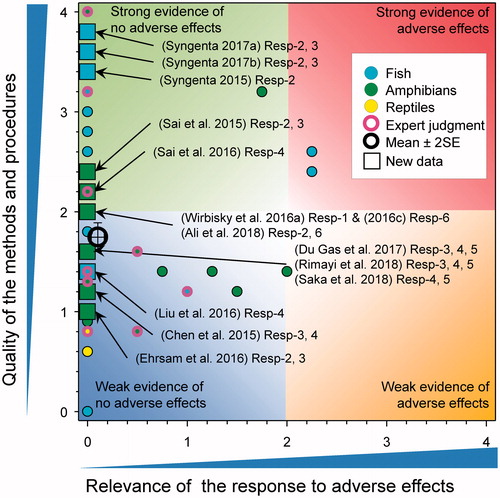
Figure 9. WoE analysis of the effects of atrazine on deformities in fish, amphibians, and reptiles. Redrawn with data from Van Der Kraak et al. (Citation2014) with new data added and included in the mean and 2 × SE of the scores. Number of responses assessed = 40. Symbols may obscure others, see SI for this paper and Van Der Kraak et al. (Citation2014) for all responses. No data points were obscured by the legend.
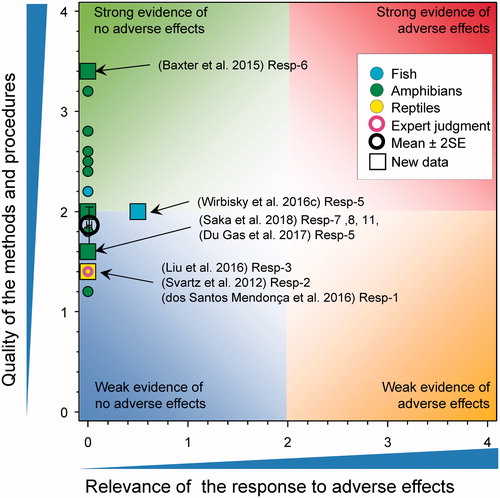
Figure 10. WoE analysis of the effects of atrazine on sex-ratio in fish, amphibians and reptiles. Redrawn with data from Van Der Kraak et al. (Citation2014) with new data added and included in the mean and 2 × SE of the scores. Number of responses assessed = 47. Symbols may obscure others, see SI for this paper and Van Der Kraak et al. (Citation2014) for all responses. No data points were obscured by the legend.
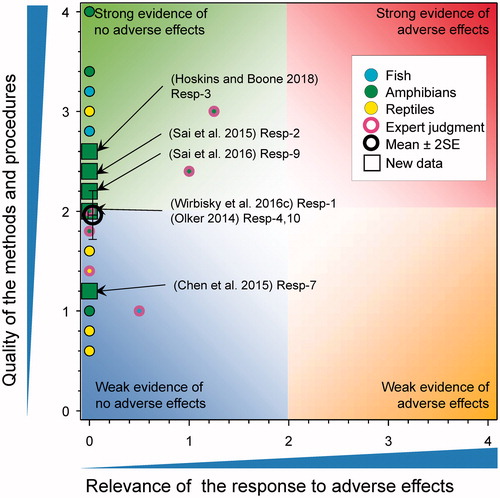
Figure 11. WoE analysis of the effects of atrazine on gonadal-somatic index in fish and amphibians. Redrawn with data from Van Der Kraak et al. (Citation2014) with new data added and included in the mean and 2 × SE of the scores. Number of responses assessed = 39. Symbols may obscure others, see Sl for this paper and Van Der Kraak et al. (Citation2014) for all responses. No data points were obscured by the legend.
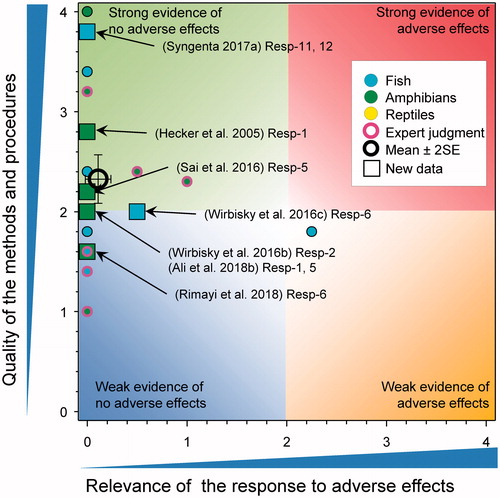
Figure 12. WoE analysis of the effects of atrazine on cell types in gonads of fish, amphibians and reptiles. Redrawn with data from Van Der Kraak et al. (Citation2014) with new data added and included in the mean and 2 × SE of the scores. Number of responses assessed = 57. Symbols may obscure others, see Sl for this paper and Van Der Kraak et al. (Citation2014) for all responses. No data points were obscured by the legend.
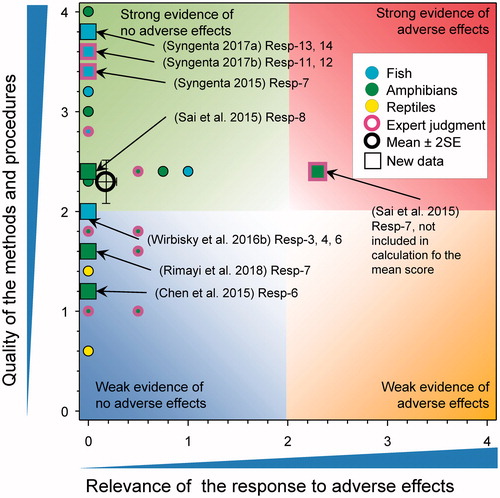
Figure 13. WoE analysis of the effects of atrazine on abnormalities of the testes in fish, amphibians and reptiles. Redrawn with data from Van Der Kraak et al. (Citation2014) with new data added and included in the mean and 2 × SE of the scores. Number of responses assessed = 24. Symbols may obscure others, see SI for this paper and Van Der Kraak et al. (Citation2014) for all responses. No data points were obscured by the legend.
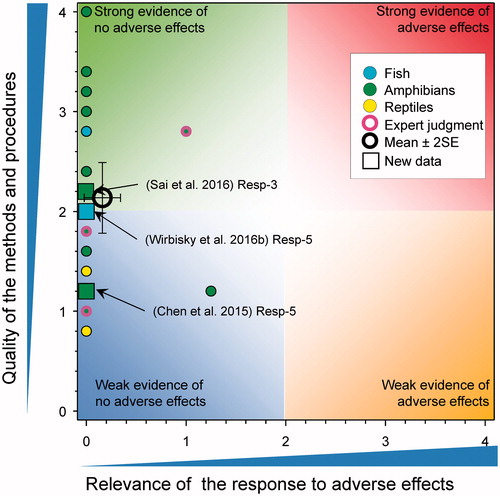
Figure 14. WoE analysis of the effects of atrazine on abnormalities of the ovaries in fish, amphibians and reptiles. Redrawn with data from Van Der Kraak et al. (Citation2014) with new data added and included in the mean and 2 × SE of the scores. Number of responses assessed = 14. Symbols may obscure others, see SI for this paper and Van Der Kraak et al. (Citation2014) for all responses. No data points were obscured by the legend.
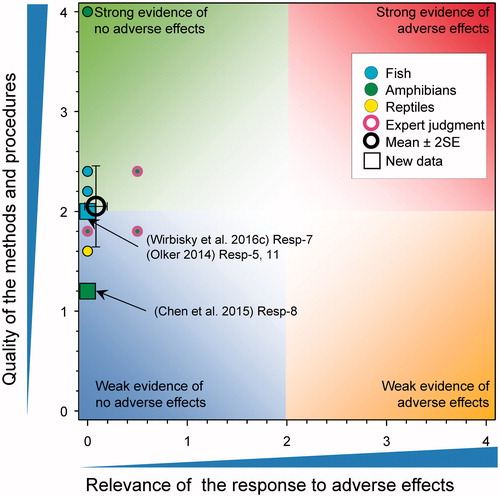
Figure 15. WoE analysis of the effects of atrazine on production of eggs in fish, amphibians, and reptiles. Redrawn with data from Van Der Kraak et al. (Citation2014) with new data added and included in the mean and 2 × SE of the scores. Number of responses assessed = 27. Symbols may obscure others, see SI for this paper and Van Der Kraak et al. (Citation2014) for all responses. No data points were obscured by the legend.
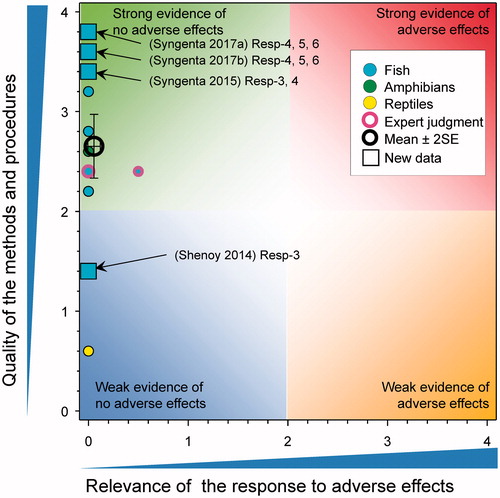
Figure 16. WoE analysis of the effects of atrazine on testicular ovarian follicles in fish, amphibians and reptiles. Redrawn with data from Van Der Kraak et al. (Citation2014) with new data added and included in the mean and 2 × SE of the scores. Number of responses assessed = 43. Symbols may obscure others, see SI for this paper and Van Der Kraak et al. (Citation2014) for all responses. No data points were obscured by the legend.
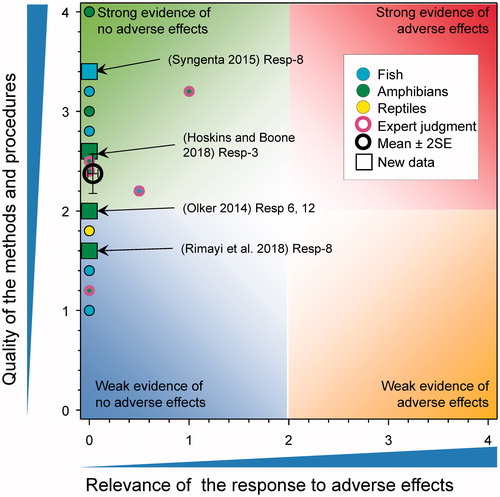
Figure 17. WoE analysis of the effects of atrazine on testicular ovarian follicles in fish, amphibians and reptiles. Redrawn with data from Van Der Kraak et al. (Citation2014) with new data added and included in the mean and 2 × SE of the scores. Number of responses assessed = 43. Symbols may obscure others, see SI for this paper and Van Der Kraak et al. (Citation2014) for all responses. No data points were obscured by the legend.
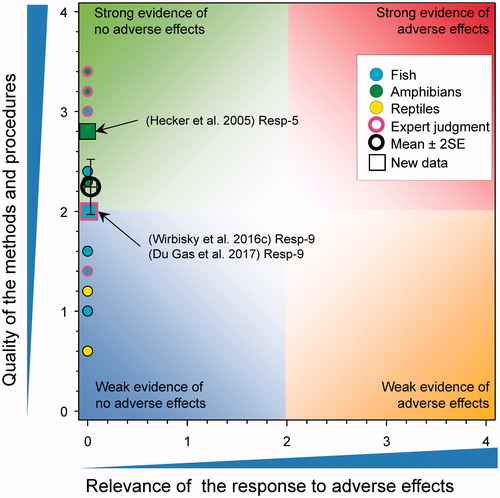
Figure 18. WoE analysis of the effects of atrazine on concentration of progestins in fish, amphibians and reptiles. Redrawn with data from Van Der Kraak et al. (Citation2014) with new data added and included in the mean and 2 × SE of the scores. Number of responses assessed = 8. Symbols may obscure others, see SI for this paper and Van Der Kraak et al. (Citation2014) for all responses. No data points were obscured by the legend.
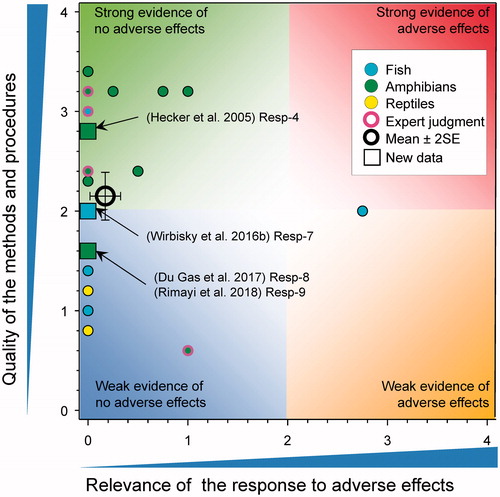
Figure 19. WoE analysis of the effects of atrazine on concentration of testosterone in fish, amphibians and reptiles. Redrawn with data from Van Der Kraak et al. (Citation2014) with new data added and included in the mean and 2 × SE of the scores. Number of responses assessed = 34. Symbols may obscure others, see SI for this paper and Van Der Kraak et al. (Citation2014) for all responses. No data points were obscured by the legend.
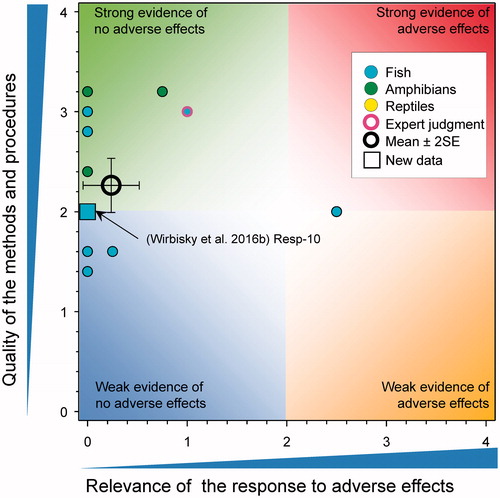
Figure 20. WoE analysis of the effects of atrazine on concentration of 11-ketotestosterone in fish, amphibians and reptiles. Redrawn with data from Van Der Kraak et al. (Citation2014) with new data added and included in the mean and 2 × SE of the scores. Number of responses assessed = 19. Symbols may obscure others, see SI for this paper and Van Der Kraak et al. (Citation2014) for all responses. No data points were obscured by the legend.
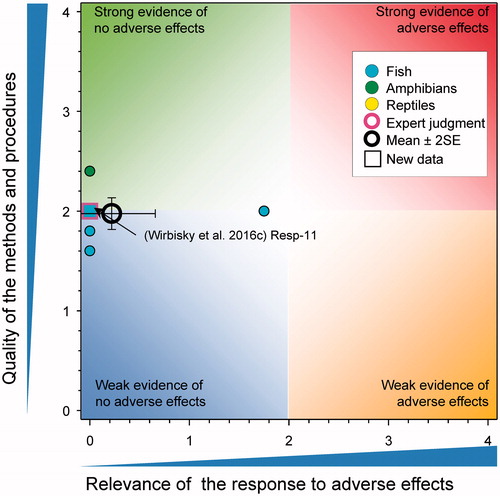
Figure 21. WoE analysis of the effects of atrazine on aromatase activity and/or expression in fish, amphibians and reptiles. Redrawn with data from Van Der Kraak et al. (Citation2014) with new data added and included in the mean and 2 × SE of the scores. Number of responses assessed = 30. Symbols may obscure others, see SI for this paper and Van Der Kraak et al. (Citation2014) for all responses. No data points were obscured by the legend.
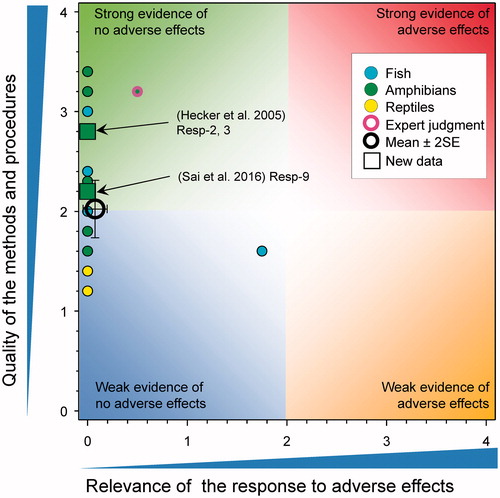
Figure 22. WoE analysis of the effects of atrazine on secondary sexual characteristics in fish, amphibians and reptiles. Redrawn with data from Van Der Kraak et al. (Citation2014) with new data added and included in the mean and 2 × SE of the scores. Number of responses assessed = 43. Symbols may obscure others, see SI for this paper and Van Der Kraak et al. (Citation2014) for all responses. No data points were obscured by the legend.
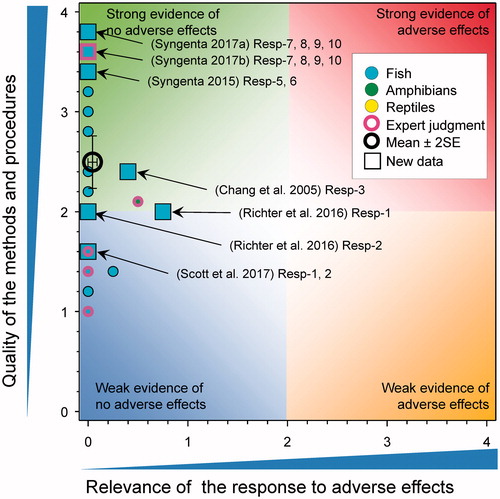
Figure 23. WoE analysis of the effects of atrazine on cortisol stress physiology in fish, amphibians and reptiles. Redrawn with data from (Van Der Kraak et al., Citation2014) with new data added and included in the mean and 2 × SE of the scores. Number of responses assessed = 23. Symbols may obscure others, see SI for this paper and Van Der Kraak et al. (Citation2014) for all responses. No data points were obscured by the legend.
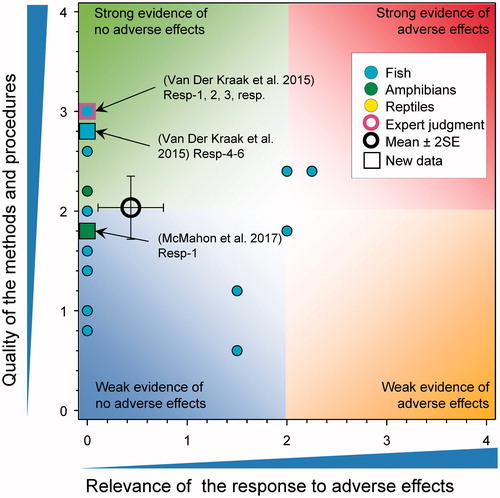
Figure 24. WoE analysis of the effects of atrazine on physiological and biochemical responses in vitro. Redrawn with data from Van Der Kraak et al. (Citation2014) with new data added and included in the mean and 2 × SE of the scores. Number of responses assessed = 18. Symbols may obscure others, see SI for this paper and Van Der Kraak et al. (Citation2014) for all responses. No data points were obscured by the legend.
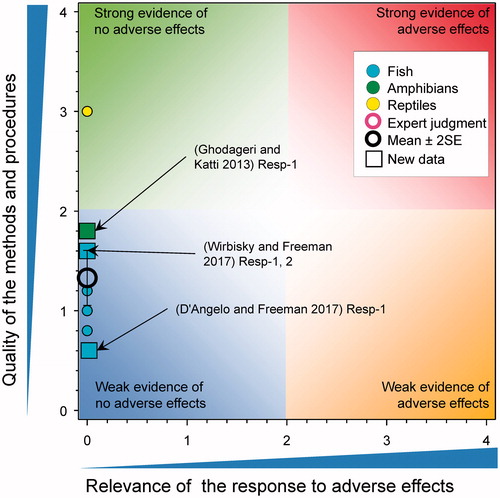
Figure 25. WoE analysis of the effects of atrazine on physiological and biochemical responses in fish and amphibians. Redrawn with data from Van Der Kraak et al. (Citation2014) with new data added and included in the mean and 2 × SE of the scores. For the key to the responses of the new studies, see the SI. Number of responses assessed = 361. Symbols may obscure others, see SI for this paper and Van Der Kraak et al. (Citation2014) for all responses. No data points were obscured by the legend.
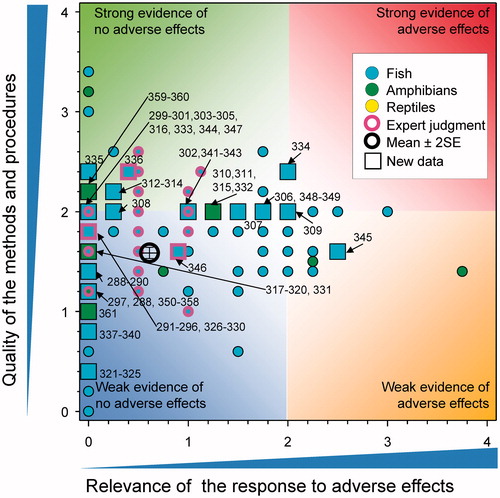
Figure 26. WoE analysis of the indirect effects of atrazine on immune function in fish and amphibians. Redrawn with data from Van Der Kraak et al. (Citation2014) with new data added and included in the mean and 2 × SE of the scores. Number of responses assessed = 64. Symbols may obscure others, see SI for this paper and Van Der Kraak et al. (Citation2014) for all responses. No data points were obscured by the legend.
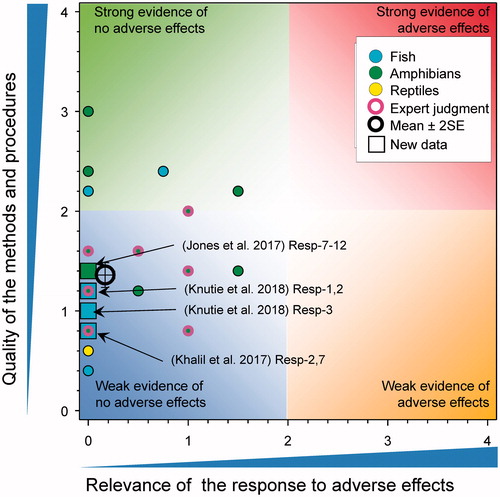
Figure 27. WoE analysis of the indirect effects of atrazine on infection of frogs by trematodes. Redrawn with data from Van Der Kraak et al. (Citation2014) with new data added and included in the mean and 2 × SE of the scores. Number of responses assessed = 51. Symbols may obscure others, see SI for this paper and Van Der Kraak et al. (Citation2014) for all responses. No data points were obscured by the legend.
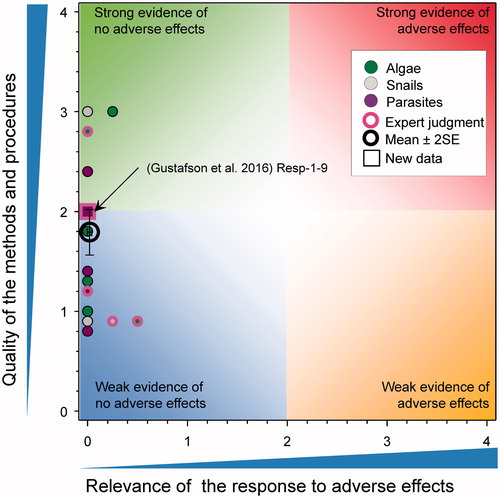
Figure 28. WoE analysis of the effects of atrazine on behavior of fish. Redrawn with data from Van Der Kraak et al. (Citation2014) with new data added and included in the mean and 2 × SE of the scores. Number of responses assessed = 42. Symbols may obscure others, see SI for this paper and Van Der Kraak et al. (Citation2014) for all responses. No data points were obscured by the legend.
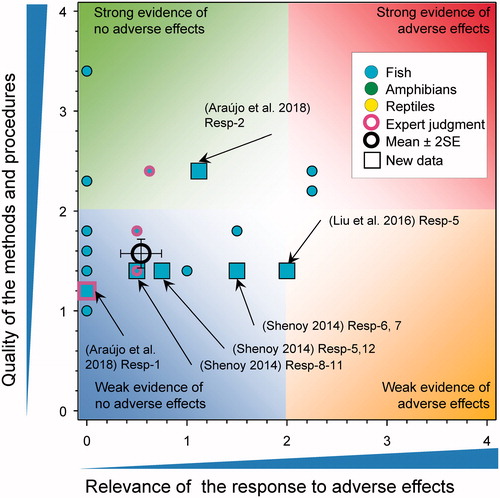
Figure 29. WoE analysis of the effects of atrazine on time to behavior of amphibians. Redrawn with data from Van Der Kraak et al. (Citation2014) with new data added and included in the mean and 2 × SE of the scores. Number of responses assessed = 33. Symbols may obscure others, see SI for this paper and Van Der Kraak et al. (Citation2014) for all responses. No data points were obscured by the legend.
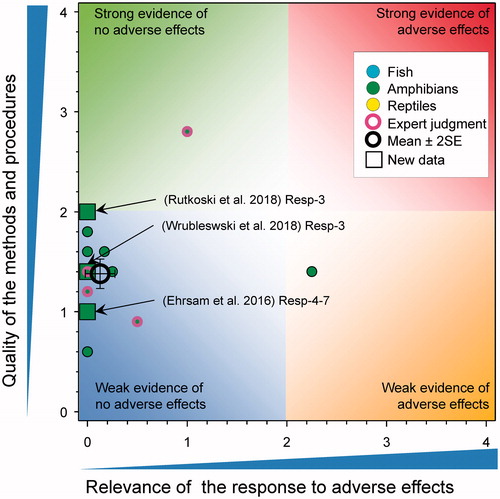
Figure 30. Overall summary of all QWoEs. Symbols are means of the original data on quality and relevance from Van Der Kraak et al. (Citation2014) combined with the new studies published since 2014. The horizontal and vertical bars indicate 2 × SE of the combined data.
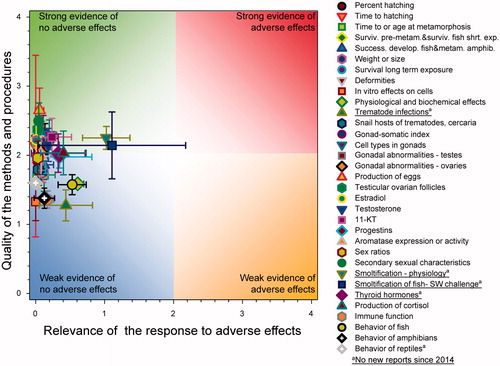
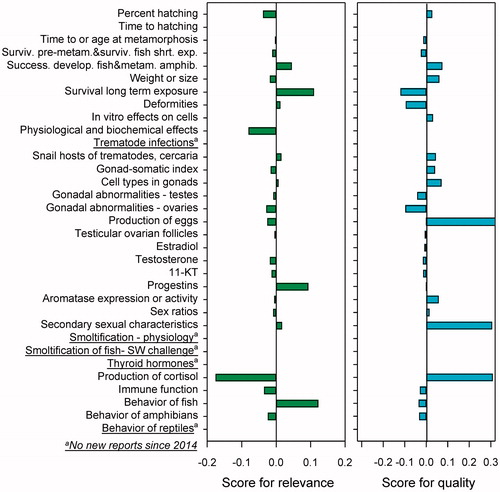
Figure 31. Differences in the scores for relevance and quality between the QWoE published in 2014 (Van Der Kraak et al. Citation2014) and the all the scores in this update. Negative values indicate lower scores for the combined scores and positive values indicate greater scores.