Figures & data
Table 1. Use scenarios for exposure prediction and risk evaluation.
Table 2. Use scenarios evaluated for SDHI fungicides.
Table 3. Proposed approach to judge the acceptability of risk based on comparison of predicted exposure with the reference dose range distribution.
Figure 1. Outline of approach to exposure and hazard prediction for risk evaluation. POD: point of departure; RfD: reference dose; GAP: good agricultural practice; MOA: mode of action.
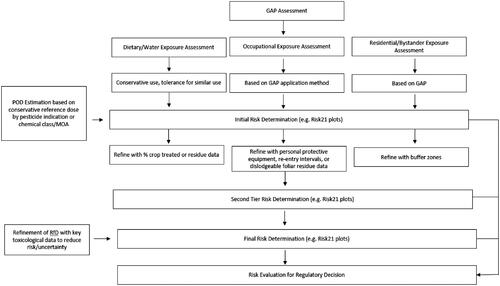
Table 4. Range of Acute Reference Dose (aPAD or ARfD) Values from US EPA, JMPR and the EU.
Table 5. Range of chronic reference dose (cPAD or ADI) values from US EPA, JMPR and the EU.
Table 6. Range of occupational reference values from US EPA and the EU.
Table 7. Basis for acute reference doses (ARfD) set by US EPA and EU commission for SDHI fungicides.
Table 8. Basis for chronic reference doses (ADI/cPAD) set by US EPA and EU commission for SDHI fungicides.
Table 9. Summary of range of exposure estimates for use scenario in USA – most sensitive population for acute and chronic dietary exposure estimates based on surrogate compounds.
Table 10. Acute and chronic exposure estimates for EU use scenario on wheat.
Table 11. Acute and chronic exposure estimates for EU use scenario for SDHI on wheat.
Table 12. Occupational exposure estimates for USA use scenarios.
Table 13. Acute and long-term occupational exposure estimates for EU fungicide use scenario on wheat.
Figure 2. Risk21 plots for fungicide USA use scenario on soya bean for acute and chronic exposure. (a) Soya bean alone at tolerance, (b) EDWC, (c) tolerance plus EDWC, and (d) US EPA aggregate assessment for surrogate substance including all crops on the label and EDWC. Line denotes median reference dose value, toxicity values are 5th and 75th percentile from the aPAD/cPAD range, respectively. Exposure values are for the most sensitive population and worst case surrogate compound for acute or chronic exposures, respectively. Blue box refers to acute duration assessment and black box refers to chronic duration assessment.
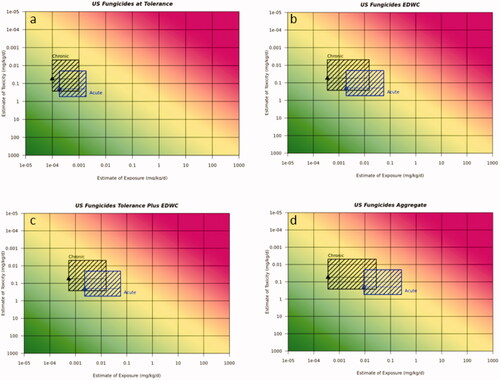
Figure 3. Risk21 plots for insecticide USA use scenario on sweet corn for acute and chronic exposure. (a) Sweet corn alone at tolerance, (b) EDWC, (c) tolerance plus EDWC, and (d) US EPA aggregate assessment for surrogate substance including all crops on the label and EDWC. Line denotes median reference dose value, toxicity values are 5th and 75th percentile from the aPAD/cPAD range, respectively. Exposure values are for the most sensitive population and worst case surrogate compound for acute or chronic exposures, respectively. Blue box refers to acute duration assessment and black box refers to chronic duration assessment.
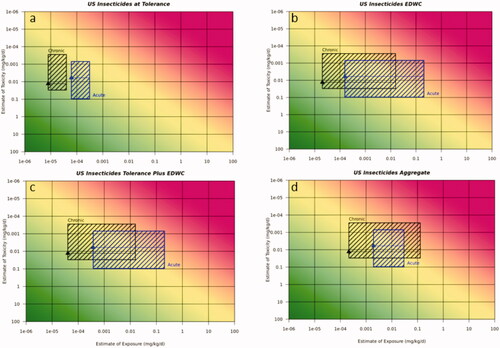
Figure 4. Risk21 plots for herbicide USA use scenario on cotton for acute and chronic exposure. (a) Cotton alone at tolerance, (b) EDWC, (c) tolerance plus EDWC, and (d) US EPA aggregate assessment for surrogate substance including all crops on the label and EDWC. Line denotes median reference dose value, toxicity values are 5th and 75th percentile from the aPAD/cPAD range, respectively. Exposure values are for the most sensitive population and worst case surrogate compound for acute or chronic exposures, respectively. Blue box refers to acute duration assessment and black box refers to chronic duration assessment.
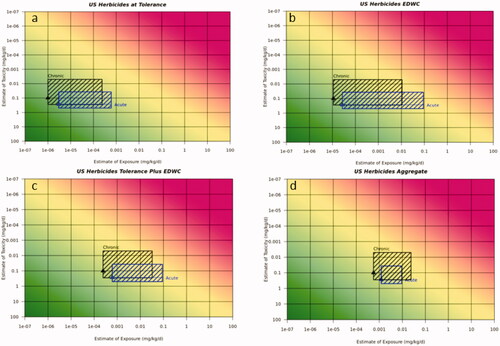
Figure 5. Risk21 plots for SDHI USA use scenario on stone fruit for acute and chronic exposure. (a) Stone fruit alone at tolerance, (b) EDWC, (c) tolerance plus EDWC, and (d) US EPA aggregate assessment for surrogate substance including all crops on the label and EDWC. Line denotes median reference dose value, toxicity values are 5th and 75th percentile from the aPAD/cPAD range, respectively. Exposure values are for the most sensitive population and worst case surrogate compound for acute or chronic exposures, respectively. Blue box refers to acute duration assessment and black box refers to chronic duration assessment.
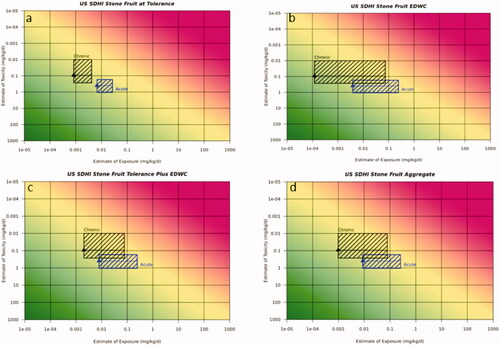
Figure 6. Risk21 plots for EU use scenarios on wheat. (a) Fungicide on wheat acute dietary exposure (b) fungicide on wheat chronic dietary exposure (c) SDHI on wheat acute dietary exposure (d) SDHI on wheat chronic dietary exposure. Line denotes median reference dose value, toxicity values are 5th and 75th percentile from the aRfD/ADI range, respectively. Exposure values are for the most sensitive population and worst case surrogate compound for acute and chronic exposures, respectively. Blue box represents acute duration exposure and black box represents chronic duration exposure.
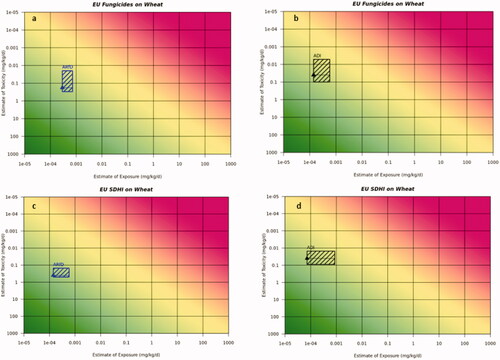
Figure 7. Risk21 plots for US occupational exposure via inhalation and dermal routes of exposure. (a) Fungicide use scenario, (b) Insecticides use scenario, (c) Herbicide use scenario, and (d) USA SDHI scenario. Line denotes median calculated occupational exposure level (OEL) reference dose value, toxicity values are 5th and 75th percentile from the range of derived dermal and inhalation occupational reference dose ranges for the USA. Exposure values were derived from the most conservative (highest potential for) exposure for inhalation and dermal exposures. Magenta box represents inhalation exposures and dark blue box represents dermal exposures.
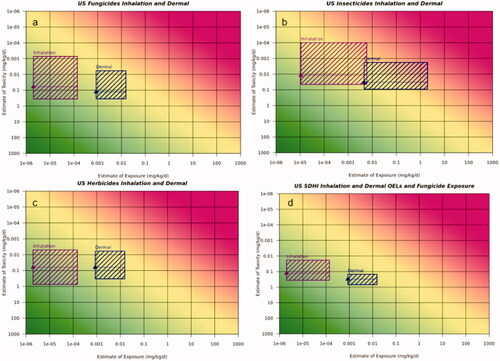
Table 14. Judgement on acceptability of risk: acute exposure for USA use scenarios.
Table 15. Judgement on acceptability of risk: chronic exposure for USA use scenarios.
Table 16. Judgement on acceptability of risk: fungicides and SDHI use scenarios for the EU acute and chronic exposure.
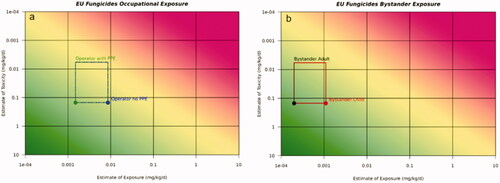
Figure 8. Risk21 plots for acute (a) and long-term operator (b) with and without PPE exposures for EU fungicide use scenario on wheat. Line denotes median reference value, toxicity values are 5th and 75th percentile from the range of systemic AOELs for fungicides in the EU.