Figures & data
Figure 1. TG and WC during seed germination and early seedling growth of Triticum aestivum. Closed circles show TG, and open circles show WC. Data are means ± SE (n = 7 replicates of 35 seeds for TG and n = 4 replicates of 35 seeds for WC). Error bars within symbols are not shown.
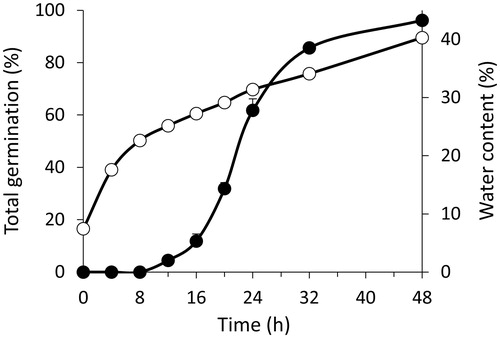
Figure 2. Changes in WC during imbibition of Triticum aestivum seeds. After 15 and 48 h from the onset of imbibition, NG seeds were sorted from G seeds. Endosperms (dark grey bars) and their embryos or seedlings (light grey bars) were dissected and analysed separately. Data are means ± SE (n = 4 replicates of 40 endosperms and embryos). After the onset of imbibition, bars labelled with the same letter do not differ significantly (one-way ANOVA analyses followed by post-hoc Tukey's HSD test, p-value ≤.05). Asterisks indicate significant differences (one-sample t-test, p-value ≤.05) between seed structures at the same time interval.
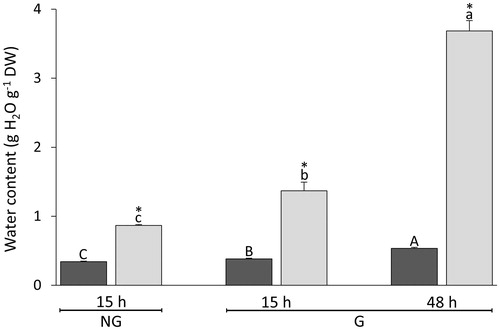
Figure 3. Concentrations of LMW thiols and corresponding disulphides during germination and early seedling growth of Triticum aestivum. The abscissa shows the time after the onset of imbibition, and time 0 indicates dry seeds. (A) GSH and GSSG; (B) Cys and CySS; (C) Cys-Gly and Cys-bis-Gly; (D) γ-Glu-Cys and bis-γ-Glu-Cys. Data are means ± SE for the four LMW thiols (white bars) and corresponding disulphides (black bars). Data labelled with the same letters do not differ significantly (one-way ANOVA analyses followed by post-hoc Tukey's HSD test, p-value ≤.05). For ease of comparison, germination curve is indicated by the grey line.
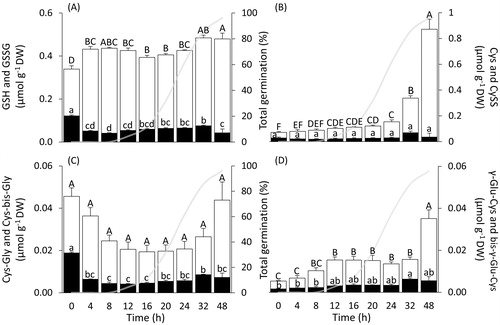
Figure 4. Concentration, on a DW basis, and redox state of four low-molecular-weight (LMW) redox couples in structures isolated from Triticum aestivum seeds upon imbibition. After 15 h from the onset of imbibition, white bars for LMW thiols and black bars for their corresponding disulphides show dry weight-based concentrations in endosperms and embryos isolated from NG seeds or G seeds. After 48 h from the onset of imbibition, bars show thiol and disulphide DW-based concentrations for endosperms and seedlings isolated from germinated seeds (panels A--D). Bars on the right side show the half-cell reduction potentials of the four LMW thiol-disulphide redox couples in the endosperm (dark grey bars) and embryo or seedling (light grey bars), respectively (panels E--H). Data for endosperms and embryos or seedlings were tested for significance using one-way ANOVA analyses followed by post-hoc Tukey's HSD test for thiols (lower case letters) and disulphides (upper case letters). Data points labelled with the same letter do not differ significantly (p-value ≤.05; italics is used for comparing the endosperms). Data are means ± SE (n = 4 replicates of 40 endosperms and embryos or seedlings per condition). NG: non-germinated; G: germinated; 15 and 48 indicate the hours after the onset of imbibition.
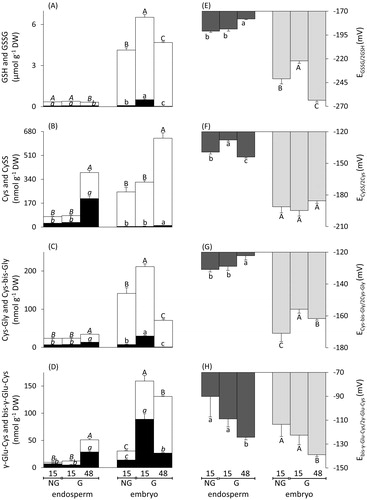
Table 1. Relative contribution of the individual half-cell reduction potentials (Ehcs) of the four LMW thiol-disulphide redox couples to the LMW thiol-disulphide redox environment (Ethiol-disulphide) in dry whole seeds and isolated Triticum aestivum seed structures upon imbibition. Values for the individual contributions of the thiol-disulphide redox couples are expressed as percentages of Ethiol-disulphide calculated for dry whole seeds and seed structures isolated after 15 or 48 h from the onset of imbibition. Data show means ± SE (n = 4). G: germinated; NG: non-germinated.
Figure 5. Changes in H2O2 production and OXO activity during Triticum aestivum seed germination and early seedling growth. White bars show the rates of H2O2 production (left axis) and black bars show OXO activity (right axis). Both variables were tested for significance using one-way ANOVA analyses followed by post-hoc Tukey's HSD test. Bars labelled with the same letter do not differ significantly (p-value ≤.05). Upper case letters are used for H2O2 production rates, and lower case letters for OXO activity. Data show means ± SE (n = 3 replicates of 25 seeds for H2O2 production; n = 4 replicates of 35 seeds for OXO activity).
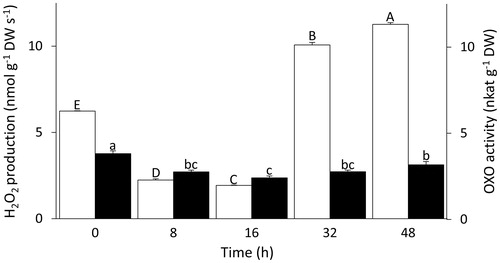
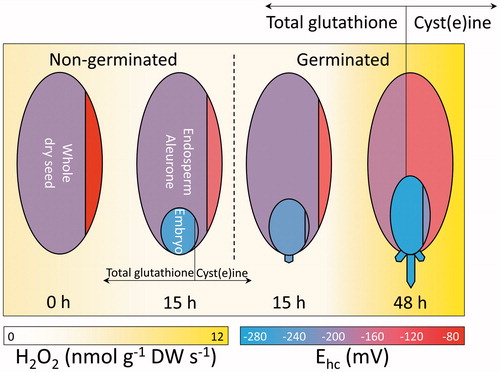
Figure 6. Overview of the changes in H2O2 and LMW thiols and disulphides during bread wheat germination and early seedling growth. From left to right, changes in LMW thiol-disulphides and H2O2 production rates in Triticum aestivum are schematically represented for a whole dry seed, seed structures isolated from non-germinated seeds after 15 h from the onset of imbibition, and seed structures isolated from germinated seeds after 15 and 48 h. Whole dry seed, endosperm including aleurone (large oval), and embryo or seedling (small oval) are divided by vertical lines. These lines delimit areas proportional to the concentrations of total glutathione (i.e. GSH (glutathione) + GSSG (glutathione disulphide), area left of line) and cyst(e)ine (i.e. Cys (cysteine)+ CySS, (cysteine) area right of line), in the respective seed structure. The redox states (Ehcs in mV) of total glutathione and cyst(e)ine are indicated by the blue-to-red (reducing-to-oxidising) shadings of each area, as shown by the bottom right scale. Yellow background shadings indicate the rates of H2O2 production (nmol g−1 DW s−1), as shown by the bottom left scale. The dashed vertical line separates seeds from seedlings.