Figures & data
Figure 1. (a) The in vitro release profiles of NPs. (b) Mean concentration of C6 in brains after IV administration of C6 formulations to rats at a dose of 0.5 mg/kg (mean ± SD, n = 3). **p < 0.01 versus the polysorbate-80 NPs group. ##p < 0.01 versus the CLS NPs group.
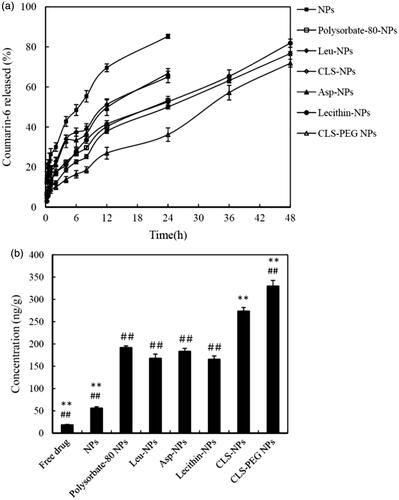
Figure 2. Cytotoxicity of (a) cholesterol, (b) PEG20000, (c) PBCA, (d) blank CLS-PEG NPs, and (e) C6 loaded CLS-PEG NPs in bEnd.3 cell line at different concentrations as assessed by MTT levels (mean ± SD, n = 5).
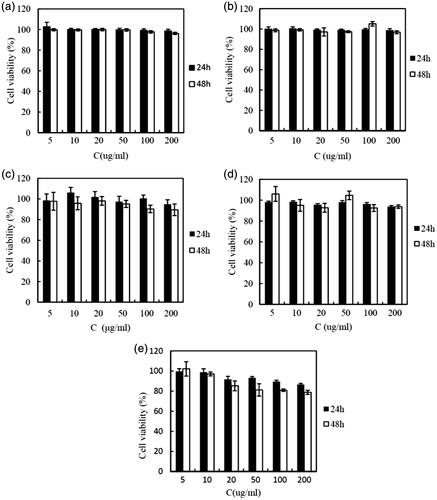
Figure 3. Effect of concentration (a) or the incubation time (b) on the cellular uptake of CLS-PEG NPs; Uptake (c) or uptake relative to control (d) of normal NPs (□), CLS NPs ![]()
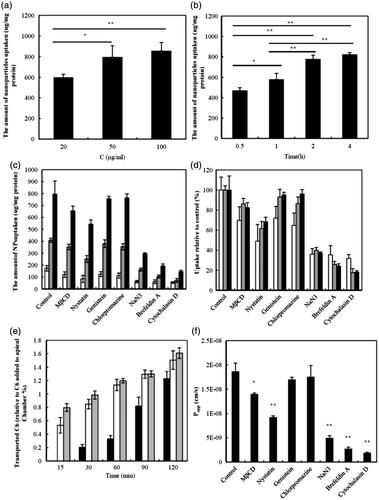
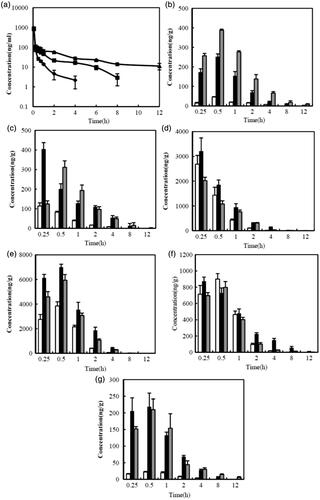
Figure 4. Mean concentration-time profiles of C6 in organs after IV administration of free C6 solution (♦) (□), CLS NPs (▪) (▪) or CLS-PEG NPs (▴) (![]()