Figures & data
Figure 1. Synthesis schematic of PEG–PCCL-MNP, PEG–PCCL, and their PTX-loaded nanoparticles. (A) PEG–PCCL-MNP (B) PEG–PCCL.
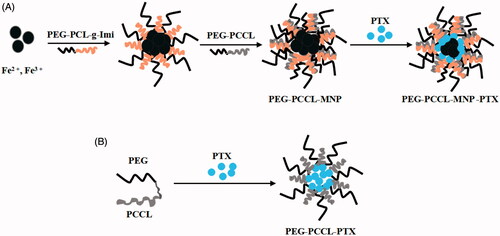
Table 1A. Characterization of PEG–PCCL-MNP (mean ± SD, n = 3).
Figure 2. Uptake image of PEG–PCCL-MNP by cells using transmission electron microscope. (A/B): normal HepG2 cells; (C/D): HepG2 cells treated with PEG–PCCL-MNP polymers; (E/F): normal HEK293 cells; (G/H): HEK293 cells treated with PEG–PCCL-MNP polymers (black arrow represents iron oxide particles; thick black arrow represents endosome of nanoparticles. Image A/C/E/G 6000×, Image B/D/F/H 12,000×).
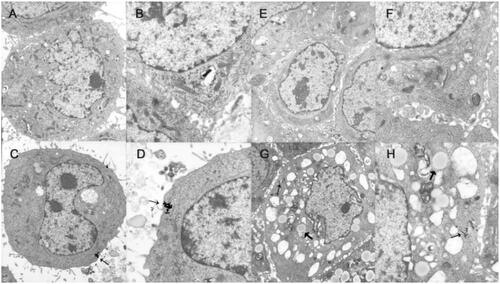
Figure 3. Effect on the cell viability of the nanoparticles on different cells by MTT assays. (A) HEK 293 cells treated with PEG–PCCL and PEG–PCCL-MNP; (B) HepG2 cells treated with PEG–PCCL and PEG–PCCL-MNP. (C) Annexin V/PI apoptosis detection after PEG–PCCL (0.5 mg/ml) and PEG–PCCL-MNP (0.5 mg/ml) treatment for 4 h. Cells stained green represents early apoptosis and cells stained red represents necrosis. (D) Hemolysis ratio in vitro after PEG–PCCL (0.5 mg/ml) and PEG–PCCL-MNP (0.5 mg/ml) treatment by different time.
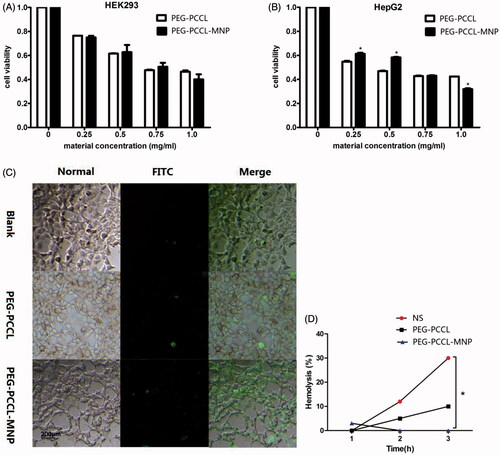
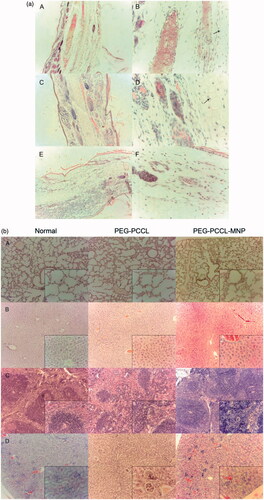
Table 1B. The renal function of PEG–PCCL-MNP (mean ± SD, n = 3).
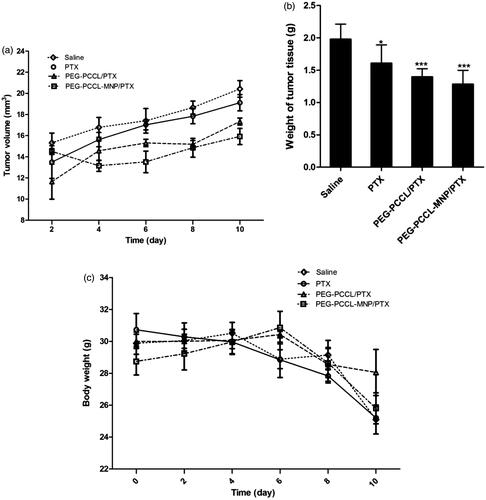
Figure 5. (A) The tumor growing curves for different treatment groups (n = 5). (B) The tumor weight of mice after treatments with different formulations (n = 5). Significant differences: *p < .05, ***p < .001, compared with the saline group. (C) The body weight of mice after treatments with different formulations (n = 5).