Figures & data
Figure 1. Schematic illustration of tumor-targeted therapy of Lys-αTS/CUR NA.
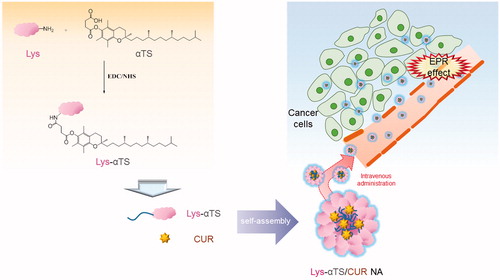
Figure 2. Synthesis of c-Lys and Lys-αTS and their characterizations. (A) The result of SDS-PAGE assay. Protein standard, Lys, c-Lys, and Lys-αTS were loaded onto the wells for gel electrophoresis. (B) The result of TNBS assay. Each point represents the mean ± SD (n = 3). ***p < .001, compared with Lys group. %%%p < .001, compared with c-Lys group. (C) MALDI-TOF choromatograms of c-Lys and Lys-αTS. Relative intenstiy (%) accroding to mass (m/z) is plotted. (D) Size distribution diagrams of c-Lys and Lys-αTS. Differential intensity according to the diameter is plotted.
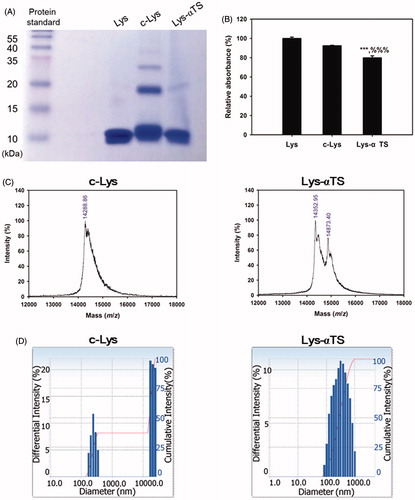
Figure 3. Particle characterizations of c-Lys/CUR NA and Lys-αTS/CUR NA. (A) Size distribution diagrams of c-Lys/CUR NA and Lys-αTS/CUR NA dispersion. The differential intensity is plotted according to the mean diameter. (B) TEM images of c-Lys/CUR NA and Lys-αTS/CUR NA dispersion. The length of the scale bar is 200 nm. (C) Drug release profile of Lys-αTS/CUR NA. Released amounts of CUR (%) from Lys-αTS/CUR NA dispersion are presented. Each point represents the mean ± SD (n = 3).
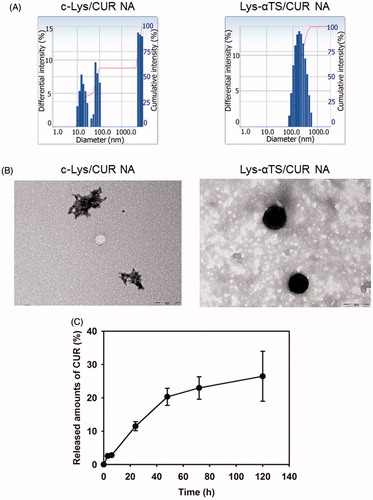
Figure 4. Cellular uptake and antiproliferation studies in MDA-MB-231 cells. (A) Cellular accumulated amounts of CUR quantitatively analyzed by flow cytometry. CUR or Lys-αTS/CUR NA (10 μg/mL CUR concentration) was incubated for 2 and 6 h. Black, green, and red colors indicate control, CUR, and Lys-αTS/CUR NA group, respectively. Each point represents the mean ± SD (n = 3). ###p < .001, compared with CUR group. (B) Intracellular distribution of NPs monitored by CLSM imaging. CUR or Lys-αTS/CUR NA (10 μg/mL CUR concentration) was incubated for 2 and 6 h. Green and blue colors indicate CUR and DAPI, respectively. The length of the scale bar in the image is 20 μm. (C) Antiproliferation assay in MDA-MB-231 cells. Cell viability (%) values of Lys, Lys-αTS, CUR, and Lys-αTS/CUR NA, according to CUR concentrations, are presented after 48 and 72 h incubation. Each point represents the mean ± SD (n = 3). #p < .05, compared with CUR group. ###p < .001, compared with CUR group.
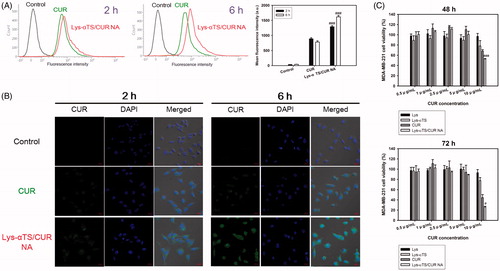
Figure 5. NIRF imaging test in MDA-MB-231 tumor-bearing mouse model. Free Cy5.5 or Cy5.5-conjugated Lys-αTS/CUR NA was injected into the tail vein of the mouse model. (A) Whole body-scanned images acquired at 0 (pre), 4, and 24 h post-injection. Red dashed circle indicates the tumor region. (B) Mean fluorescence intensity values in the tumor region. Each point represents the mean ± SD (n = 3). +++p < .001, compared with free Cy5.5 group. (C) Ex vivo NIRF image of dissected tumor tissues at 24 h post-injection. (D) Mean fluorescence intensity values in liver, lungs, heart, kidneys, spleen, and tumor are presented. Each point represents the mean ± SD (n = 3). ++p < .01, compared with free Cy5.5 group.
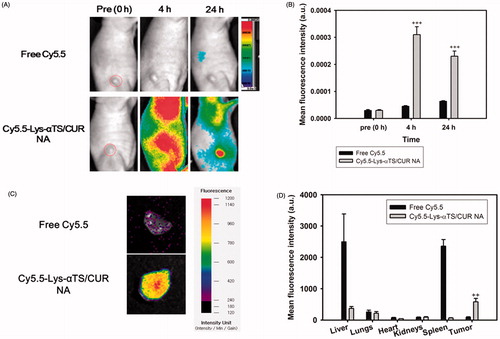
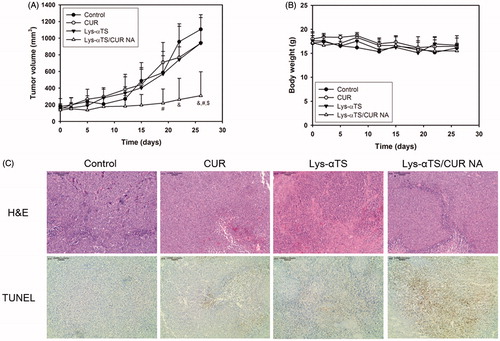
Figure 6. In vivo anticancer activity tests in MDA-MB-231 tumor-bearing mouse models. (A) Tumor volume profiles of control, CUR, Lys-αTS, and Lys-αTS/CUR NA groups. CUR, Lys-αTS and Lys-αTS/CUR NA were injected intravenously on day 5, 8, 12, 15, 19, and 22, respectively. Each point indicates the mean ± SD (n ≥ 3). &p < .05, compared with the control group. #p < .05, compared with CUR group. $p < .05, compared with Lys-αTS group. (B) Profiles of body weight of control, CUR, Lys-αTS, and Lys-αTS/CUR NA groups. Each point indicates the mean ± SD (n ≥ 3). (C) Staining images of dissected tumor tissues. The microscopic images of H&E staining (upper panel) and TUNEL assay (lower panel) are shown. The length of scale bar in the image is 100 μm.