
Figures & data
Table 1. Composition of GTE-loaded CS-TPP nanoparticles with and without different additives.
Figure 1. (A) GTE fingerprint, (B) GTE fingerprint and marker compounds (i) GTE, (ii) caffeine, (iii) catechin, (iv) epigallocatechingallate, and (v) epicatechin.
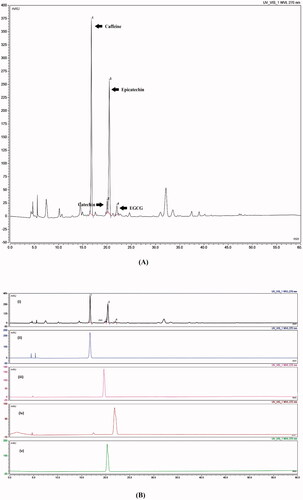
Table 2. Mean EE%, PS, PDI and ZP of the prepared formulae.
Figure 2. Effect of addition of lecithin at different CS: TPP mass ratios: (A) 25 mg lecithin on EE%, (B) 10, 25 and 50 mg lecithin on EE%, (C) 25 mg lecithin on PS, (D) 10, 25, 50 mg lecithin on PS, (E) 25 mg lecithin on ZP, and (F) 10, 25, 50 mg on ZP.
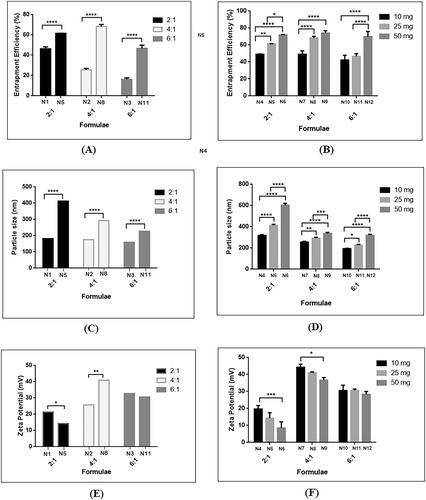
Figure 3. Microscopic examination: (A) TEM, and (B) SEM.
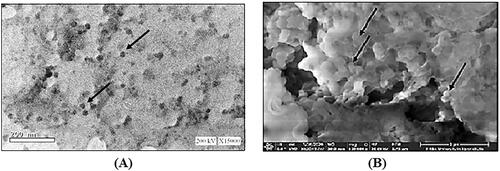
Figure 4. DSC thermogram of: (A) CS, (B) lecithin, (C) TPP, (D) GTE, (E) Physical mixture, (F) void nanoparticles and (G) GTE-loaded CS nanoparticles.
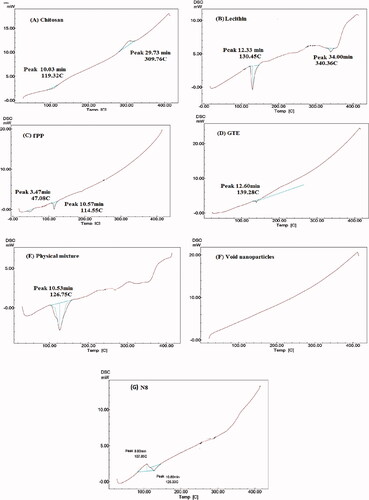
Figure 5. FTIR spectrum of: (A) CS, (B) lecithin, (C) TPP, (D) GTE, and (E) N8.
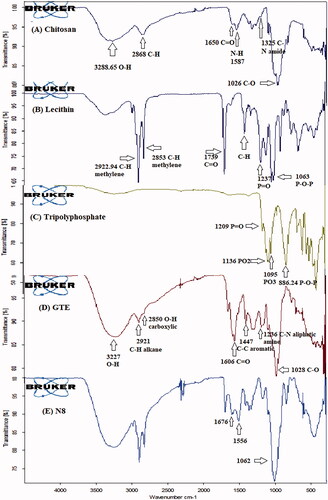
Figure 6. X-ray diffractogram of: (A) CS, (B) TPP, (C) GTE, and (D) GTE-loaded CS nanoparticles.
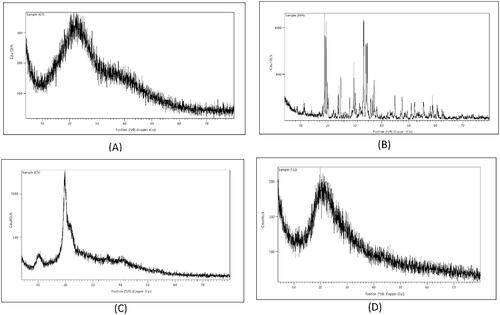
Figure 7. Percentage release of GTE from N8 and F* after 48 hours.
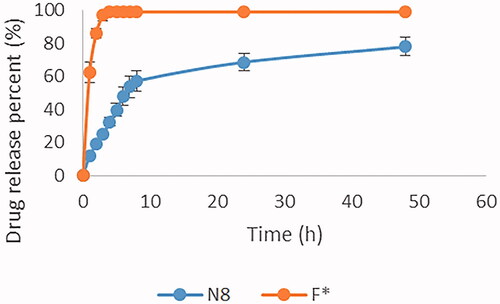
Table 3. Different release models and Korsemeyer Peppas model.
Table 4. Amount and percentage retention of each of the investigated components in skin after application of nanoparticles and GTE solution equivalent to 3 mg for 48 h.
Figure 8. Control group showing: adipocytes (A), subcutaneous fat layer thickness (B), Groups B and C showing: significant reduction in area and size of adipocytes (C) and (E), a marked decrease in the subcutaneous fat layer thickness (D) and (F).
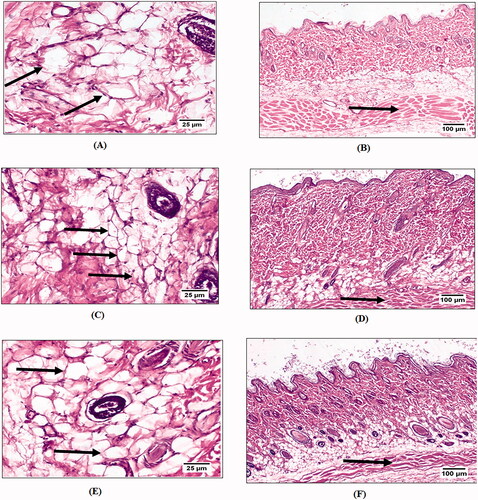
Table 5: Effect of topical treatment of group B and group C after 21 days on perimeter and area of the adipocytes as well as the thickness of fat layer compared to negative control group A.
Table 6. Amount (µg) of each component of GTE retained in skin after 21 days of topical application present in 0.785 cm2 skin samples.