
Figures & data
Table 1. Box-Behnken design for optimization of the TBN-NVS.
Table 2. Composition of TBN-NVS Formulations based on the Box-Behnken design and the observed response variables.
Figure 1. Model diagnostic plots of the three independent variables (a) linear correlation plots between actual and predicted values for various responses of TBN-NVS, (b) normal quantile-quantile plots of residual errors and (c) plot of residual error vs. model predicted responses.
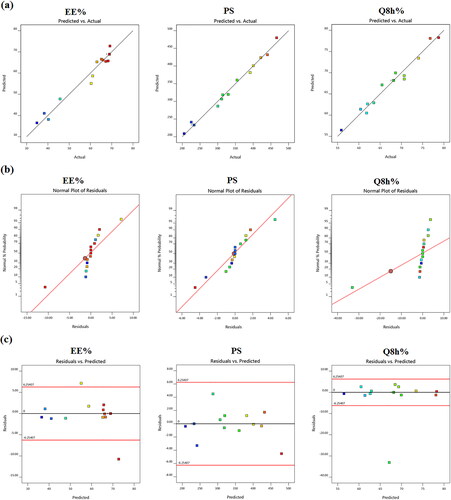
Figure 2. (a) Response 3D plots and (b) cube plot for the effect of cholesterol (X1), Span 60 (X2) and stearic acid (X3) concentrations on the entrapment efficiency percent (Y1).
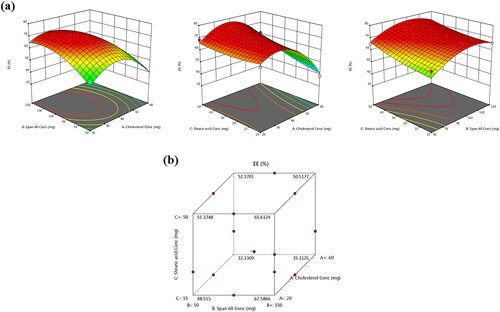
Figure 3. (a) Response 3D plots and (b) cube plot for the effect of cholesterol (X1), Span 60 (X2) and stearic acid (X3) concentrations on the particle size (Y2).
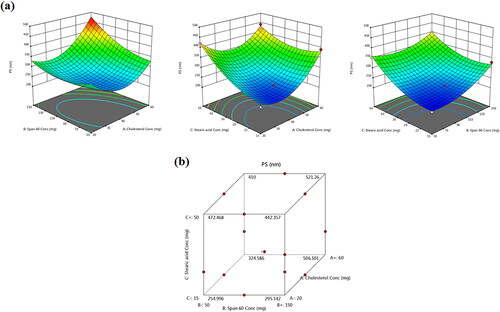
Figure 4. (a) Response 3D plots and (b) cube plot for the effect of cholesterol (X1), Span 60 (X2) and stearic acid (X3) concentrations on the accumulative % drug release after 8 h (Y3).
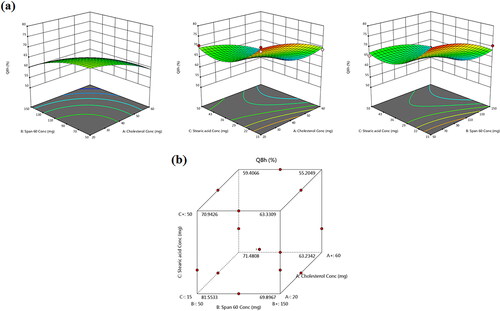
Table 3. Results of regression analysis for responses Y1 (EE%), Y2 (PS) and Y3 (Q8h%).
Table 4. TBN-NVS optimal formulation composition with the laboratory measured and model predicted characteristics.
Figure 5. Transmission electron micrograph of the optimized TBN-NVS formulation.
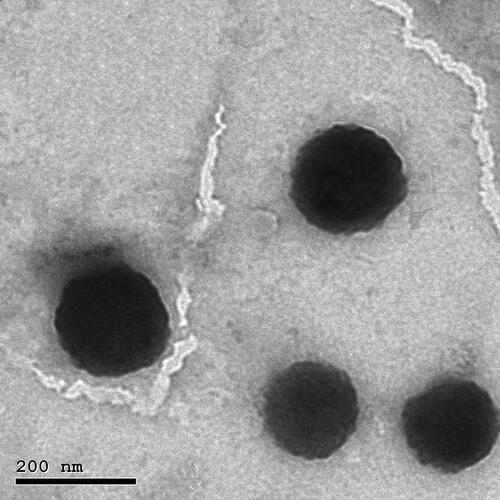
Figure 6. Effect of storage on the EE%, particle size and ζ potential of the optimized TBN-NVS formulation.
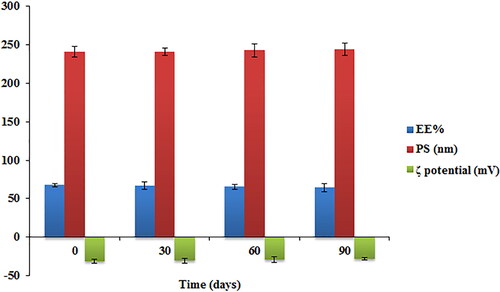
Table 5. Cascade impaction results of TBN-NVS.
Figure 7. Light photomicrographs showing histopathological sections of (a) control untreated rat lung and (b) rat lung received an intratracheal suspension of TBN-NVS formulation (200X H & E).
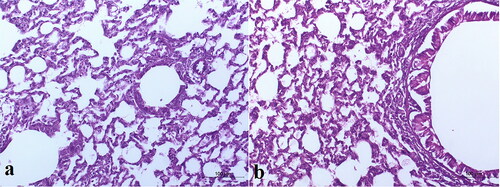
Figure 8. TBN plasma concentration time profiles after administration of oral TBN solution, i.t TBN solution and i.t TBN-NVS suspension.
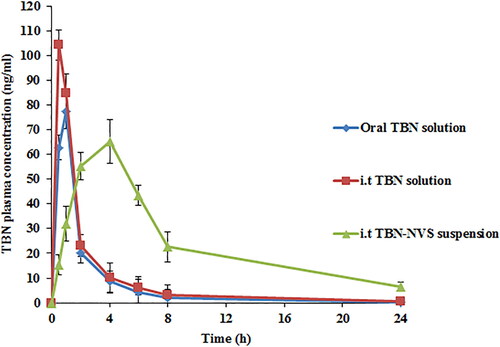
Table 6. The mean pharmacokinetic parameters of TBN in rat plasma following administration of oral TBN solution, i.t TBN solution and i.t TBN-NVS suspension.
Data availability statement
All processed data in this work are incorporated into the article.