
Figures & data
Figure 1. Timeline in relation to main COMPARE trial.
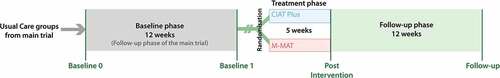
Figure 2. CONSORT participant flow diagram.
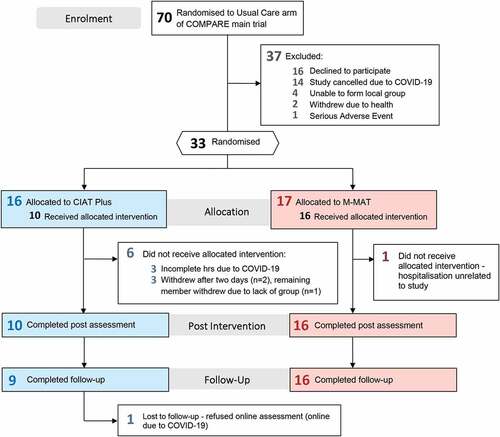
Table 1. Baseline participant characteristics.
Figure 3. Mean group changes (± SD) over time for CIAT-Plus and M-MAT.
Note: Purple marks indicate significance of combined group data. * p < .05; ** p < .01.Bonferroni correction applied to p-values within ANOVAs for each outcome measure.
† Data not normally distributed, therefore median displayed
‡ One outlier removed for this figure and for the analysis. Sensitivity test indicated no impact of removal
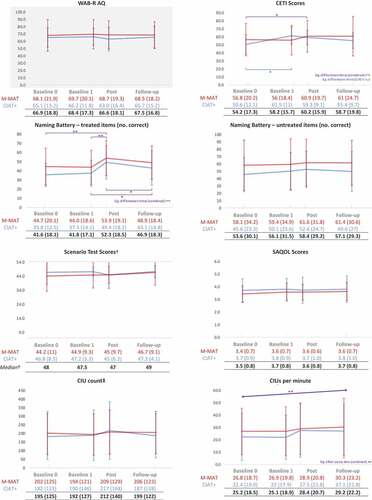
Table 2. Significant outcomes across this trial and COMPARE.
Table A1. Linguistics levels for nouns and verbs.
Table A2. Cueing hierarchies for CIAT-Plus and M-MAT.
Supplemental material
Supplemental Material
Download MS Word (936.3 KB)Data availability statement
The data that support the findings of this study are available from the corresponding author, JEP, upon reasonable request.