Figures & data
Table 1. Ascorbate peroxidase (APX), superoxide dismutase (SOD), and catalase (CAT) activities in seven date palm varieties at ripening stage.
Table 2. Total phenolics, flavonoids, anthocyanins, and tannins content in seven date palm varieties at ripening stage.
Figure 1. Comparison of antioxidant capacity in seven date palm varieties at ripening stage. Means with the same letter are not significantly different from each other (p ≤.05).
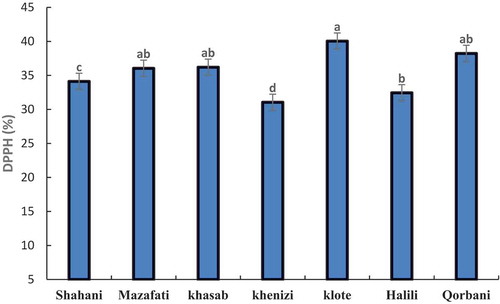
Figure 2. Correlation between phenolic compounds and antioxidant capacity in seven date palm varieties at ripening stage.
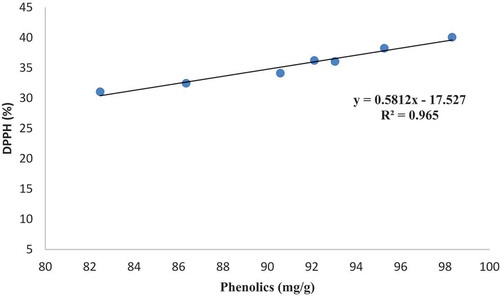
Figure 3. Comparison of soluble sugar content in in seven date palm varieties at ripening stage. Means with the same letter are not significantly different from each other (p ≤.05).
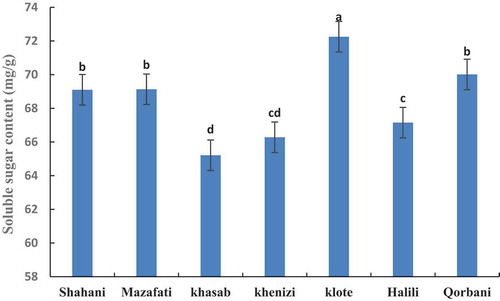
Figure 4. Comparison of reducing sugar content in seven date palm varieties at ripening stage. Means with the same letter are not significantly different from each other (p ≤.05).
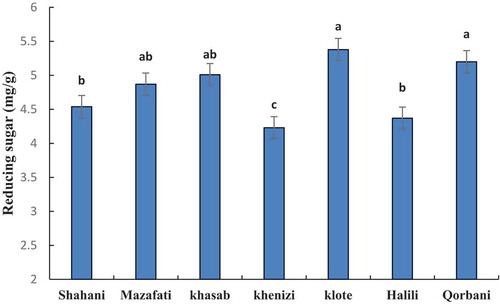
Figure 5. Comparison of carotenoid content in seven date palm varieties at ripening stage. Means with the same letter are not significantly different from each other (p ≤.05).
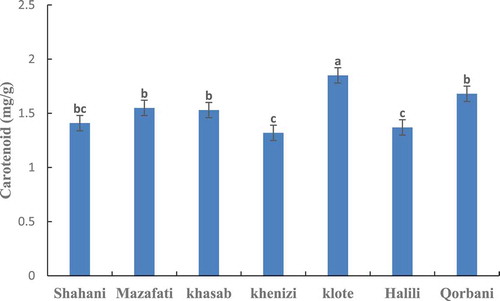
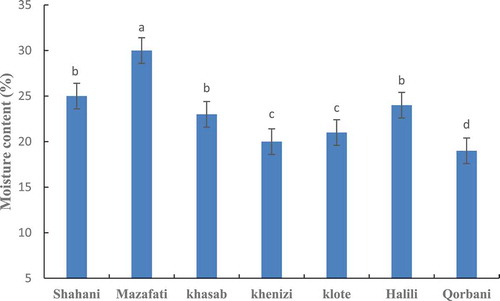
Figure 6. Comparison of moisture content in in seven date palm varieties at ripening stage. Means with the same letter are not significantly different from each other (p ≤.05).