4,232
Views
0
CrossRef citations to date
0
Altmetric
Research Article

Viewing interprofessional collaboration through the lens of networked ecological systems theory

ORCID Icon, ORCID Icon, ORCID Icon, ORCID Icon, ORCID Icon, ORCID Icon, ORCID Icon & ORCID Icon show all
Pages 777-785 | Received 21 Jun 2021, Accepted 12 Nov 2021, Published online: 11 Jan 2022

Figures & data

Figure 1. Hypothetical example illustrating a networked healthcare ecology [Adapted from Neal, J.W., & Neal, Z.P. (2013). Nested or networked? Future directions for ecological systems theory. Social Development, 22(4), 722–737. https://doi.org/10.1111/sode.12018].

1. The solid lines represent intra- and interprofessional interactions; the dotted lines represent system boundaries. 2. Dotted lines indicate that system boundaries are permeable. 3. The different shapes of ovals and rectangles used to represent different ecological systems do not have any special significance. They were chosen merely for esthetic reasons to keep the diagram compact.
Figure 1. Hypothetical example illustrating a networked healthcare ecology [Adapted from Neal, J.W., & Neal, Z.P. (2013). Nested or networked? Future directions for ecological systems theory. Social Development, 22(4), 722–737. https://doi.org/10.1111/sode.12018].

Figure 2. Disease-based outpatient clinics as clinical microsystems.
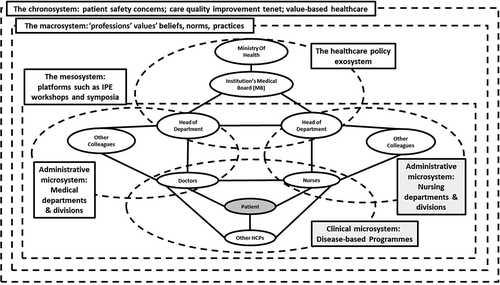
1. The solid lines represent intra- and interprofessional interactions; the dotted lines represent system boundaries. 2. Dotted lines indicate that system boundaries are permeable. 3. The different shapes of ovals and rectangles used to represent different ecological systems do not have any special significance. They were chosen merely for esthetic reasons to keep the diagram compact.
Figure 2. Disease-based outpatient clinics as clinical microsystems.
Supplemental material

Supplemental Material

Download MS Word (226.4 KB)