
Figures & data
Table 1. Comparisons of patient background characteristics between osteopenia and non-osteopenia group.
Table 2. Comparisons on patients' backgrounds between TRT and control groups.
Figure 1. Changes of adiponectin, waist circumference, body mass index, body fat percentage, muscle volume, HbA1c, total cholesterol, triglyceride, and HDL-cholesterol, from baseline to 12-month visit between TRT and control groups were shown. A significant decrease in HDL-Chol was observed in the TRT group at the 12-month visit, whereas it was not observed in the control group. There were no significant changes in adiponectin levels, waist circumference, BMI, body fat percentage, whole muscle volume, HbA1c, Tchol, and TG values between both groups. *Significant difference; ♦, TRT group; ▪, control group.
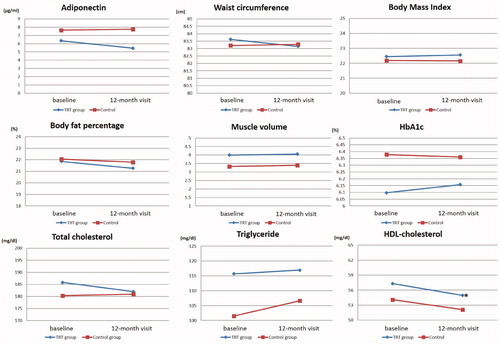
Figure 2. Changes of BMD from baseline to 12-month visit between TRT and control groups were shown. BMD showed a significant increase by 12-month treatment in both groups. *Significant difference; ♦, TRT group; ▪, control group.
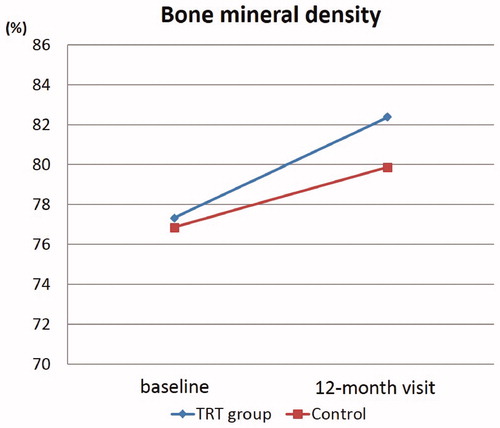
Table 3. Comparisons on changes from baseline to 12-month visit in each parameter.
Table 4. Comparisons on changes from baseline to 12-months visit between TRT and control groups.