
Figures & data
Table 1. Characteristics of patients with diabetes mellitus and healthy individuals.
Figure 1. Comparisons of the genotype frequency and allele frequency of SNPs of FHL5/LPA genes in DM case and healthy control. (a) Comparisons of the genotype frequency of rs2252816 of FHL5 gene between the two groups. (b) Comparisons of the genotype frequency of rs9373985 of FHL5 gene between the two groups. (c) Comparisons of the genotype frequency of rs3124784 of LPA gene between the two groups. (d) Comparisons of the genotype frequency of rs7765781 of LPA gene between the two groups. (e) Comparisons of the allele frequency of rs2252816 of FHL5 gene between the two groups. (f) Comparisons of the allele frequency of rs9373985 of FHL5 gene between the two groups. (g) Comparisons of the allele frequency of rs3124784 of LPA gene between the two groups. (h) Comparisons of the allele frequency of rs7765781 of LPA gene between the two groups. ‘*’ indicate statistical significance at the 0.05 level.
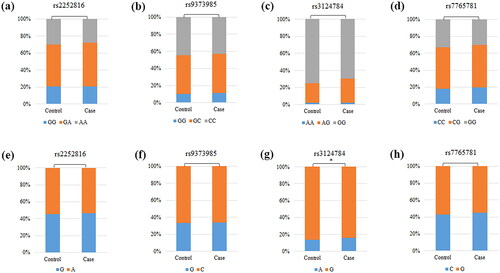
Figure 2. Analysis of the association between susceptibility of DM and SNPs. DM, diabetes mellitus; SNP, single nucleotide polymorphisms; or, odds ratio; CI, confidence interval; p values represent adjusted for age, gender, smoking, and drinking; p < 0.05, bold text and ‘*’ indicate statistical significance.
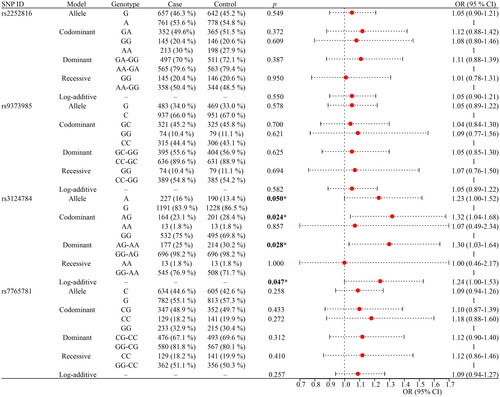
Table 2. the Basic information and HWE about the selected SNPs.
Table 3. the SNPs associated with susceptibility of diabetes mellitus in the subgroup tests (age and gender).
Table 4. the SNPs associated with susceptibility of diabetes mellitus in the subgroup tests (smoking and drinking).
Table 5. the SNPs associated with susceptibility of diabetes mellitus in the subgroup tests (course of diabetes mellitus and retinal degeneration).
Table 6. the SNPs associated with susceptibility of diabetes mellitus in the subgroup tests (BMI).
Figure 3. Dendrogram of SNP-SNP interactions. The colors in the tree diagram represent synergy or redundancy.
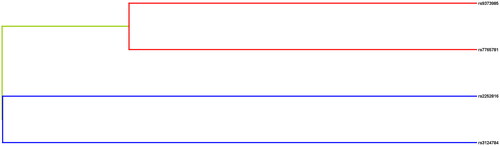
Table 7. SNP–SNP interaction models analyzed by the MDR method.
Table 8. Clinical characteristics of patients (N = 710) based on the genotypes of selected SNPs.