Figures & data
Figure 1. Model structure diagram.
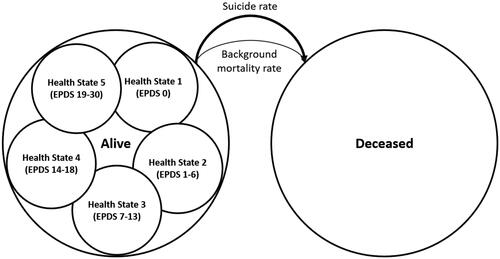
Table 1. Model inputs.
Figure 2. Efficacy sources for zuranolone and SSRIs.
aITC reference: Meltzer-BrodyCitation62. b Observation time points correspond to months 8, 21, and 33, respectively, from Netsi et al.
Abbreviations: EPDS, Edinburgh Postnatal Depression Scale; LOCF, last observation carried forward; PPD, postpartum depression; SSRI, selective serotonin reuptake inhibitor; ZRN, zuranolone; ITC, indirect treatment comparison.
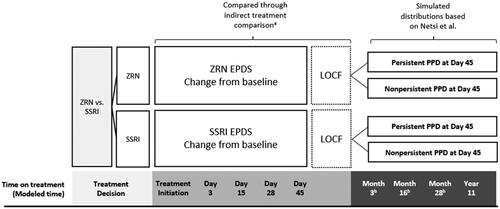
Table 2. Summary of base case results (11-year time horizon).
Table 3. Scenario analysis.
Figure 3. One-way sensitivity analysis.
Note: Change from baseline input values were negative, such that the high value represented the smaller numerical change.
Abbreviations: WTP, willingness-to-pay; QALY, quality-adjusted life year; BL, baseline; PPD, postpartum depression; SSRI, selective serotonin reuptake inhibitor.
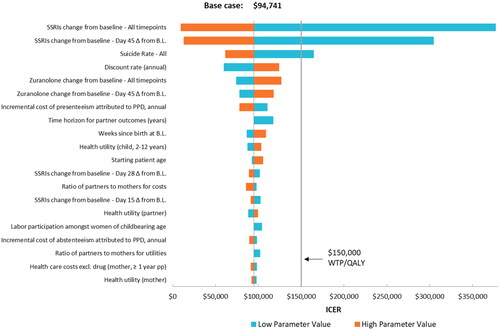
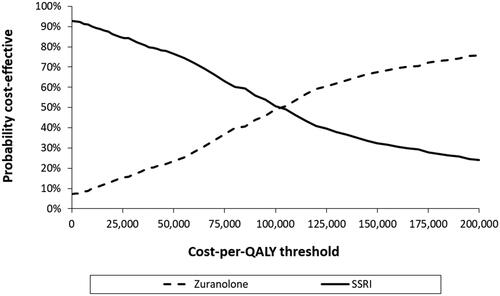
Figure 4. Probabilistic sensitivity analysis.