Figures & data
Figure 1. Effect of LB on body weights in PCPA-induced insomnia rat. The bodyweight of the animals is weighed for 10 consecutive days. Animals were intraperitoneally injected PCPA for the first two days and administered by gavage for 7 days.
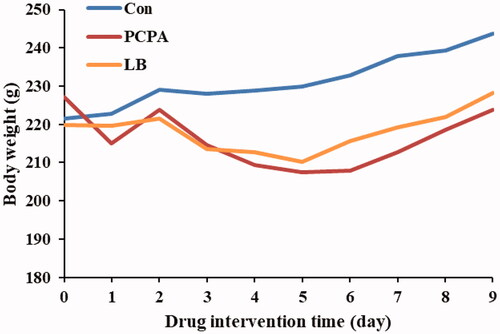
Figure 2. Effects of LB on hypothalamic levels of 5-HT (A), NE (B) and MT (C) in PCPA-induced insomnia rat. Control: received only saline treatment; PCPA: treated with 400 mg/kg PCPA only; LB: PCPA + 598.64 mg/kg LB. Values are presented as the means ± SD, n = 8. *p < .05, **p < .01 compared with Control; #p < .05, ##p < .01 compared with PCPA using One-Way ANOVA.
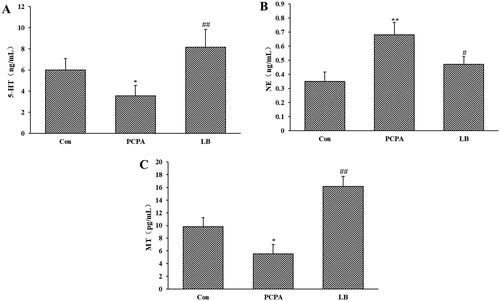
Figure 3. Histopathological observation of hypothalamic slices in rats. Hypothalamic sections were stained with haematoxylin and eosin (H&E stain 200×). (A) Con: Control (untreated); (B) PCPA (400 mg/kg alone); (C) LB: PCPA + 598.64 mg/kg LB.
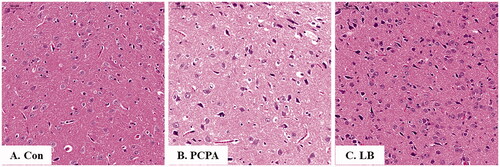
Figure 4. Effects of LB on the hypothalamic levels of 5-HT (A), NE (B) and MT (C) in PCPA-induced insomnia rats. Control: untreated; PCPA: 400 mg/kg PCPA alone; LB: PCPA + 598.64 mg/kg LB. Values are presented as the means ± SD, n = 8. Different letters indicate significant differences (p < .05) among samples by One-Way ANOVA test.
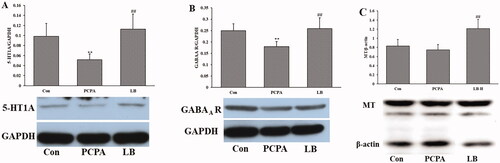
Figure 5. Changes in the richness and diversity of intestinal flora caused by LB treatment. (A) The OTU rank abundance of the intestinal flora in rats. (B) Bacterial richness estimated based on the Chao 1 value; (C) Bacterial diversity estimated from the Shannon index. The red, blue and yellow curves represent the control, LB and PCPA groups, respectively.
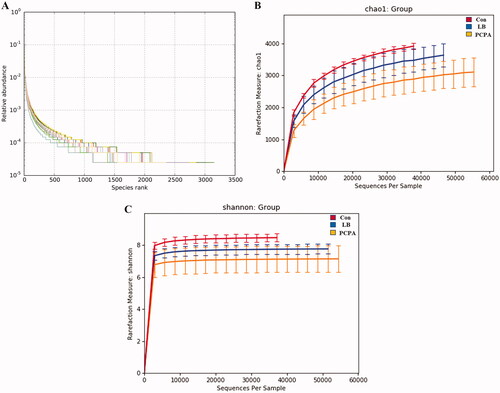
Figure 6. Effects of LB on intestinal flora in rats with insomnia induced by PCPA. (A) Veen diagram: The value inside the OTU in this area represents the number of OTUs. The control, PCPA and LB groups were marked yellow, blue and red, respectively. (B) PCoA score plots of OTUs for the control, PCPA and LB groups. (C) Relative gut microbiota abundance at the and genus-level in control, PCPA, and LB groups.
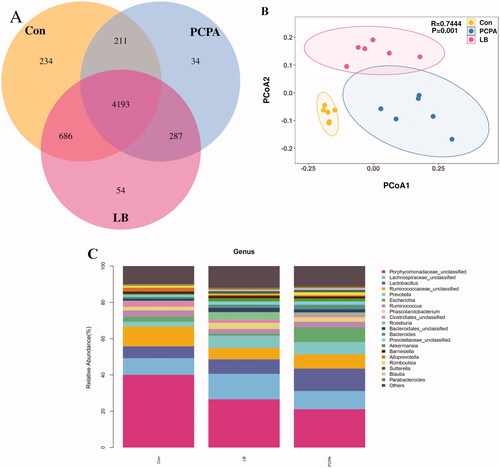
Figure 7. Effects of LB on the faecal metabolic profiles in PCPA-induced insomnia rats. (A, B) Score scatter plot of OPLS-DA in the PCPA and LB groups. Parameters for permutation test of OPLS-DA were R2X = 0.466, R2Y = 0.999 (p = 0.02), and Q2 = 0.657 (p = 0.025) in the PCPA group, R2X = 0.516, and R2Y = 0.998 (p = 0.03) and Q2 = 0.662 (p = 0.01) in the LB group. (C, D) Volcano plot: In the Vol-plot load graph, metabolite points that are significantly far from the origin (VIP > 1, p < 0.05) were selected as potential markers. Red dots represent upregulated metabolites, blue dots represent downregulated metabolites, grey dots indicate non-significant differences.
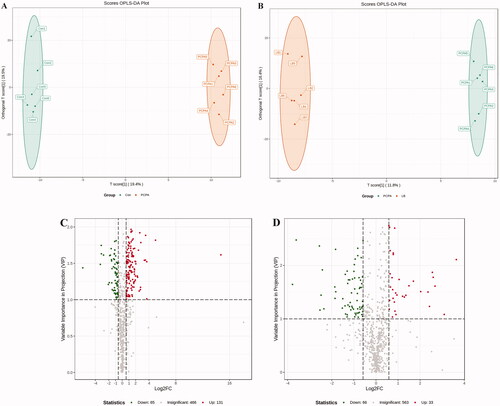
Table 1. 37 Differential metabolites tending to normal levels after LB treatment.
Figure 8. KEGG pathway enrichment analysis of differential metabolites after PCPA treatment (A) and LB treatment (B). The rich factor is the ratio of the number of differentially expressed metabolites in the corresponding pathway to the total number of metabolites annotated by this pathway. The larger the value, the greater the degree of enrichment. The colour of the dots is the p-value, the redder the more significant the enrichment. The size of the dots represents the number of differential metabolites enriched.
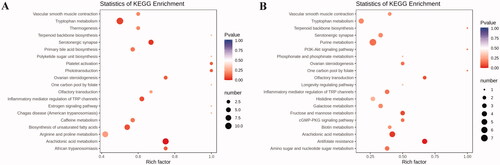
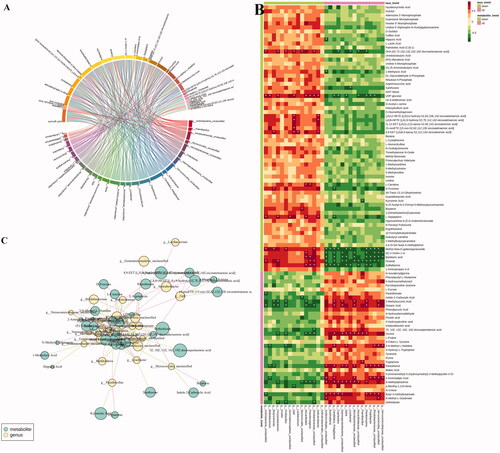
Figure 9. The relevance between the gut microbiota at the genus level and the differential faeces metabolites. (A) Chord diagram, the width of the chord link represents the strength of the interaction between the connected flora and the metabolites. The wider the link, the stronger the interaction. (B) Spearman’s correlation heat map: red indicates a positive correlation, while blue indicates a negative correlation. The deeper colour means a greater correlation (*p < 0.05). (C) The gut microbiota in genus level predicted by metabolic variation (|r| > 0.7, p < 0.05) is labelled with a similarity value. Lines connecting with metabolites (blue) show the direction of relevance to each genus of microbe (yellow) with the red (positive) or green (negative) lines.