Figures & data
Table I. Experimental and recalculated “free” IC50 values (μM).
Figure 1 The dependence of MgATP2– concentration in the reaction mixture containing 2 mM ATP and 5 mM MgCl2 on the experimental Me2+ concentration: (▾) Cu2+; (▴) Co2+; (▪) Zn2+; (•) Fe2+, Hg2+, Pb2+.
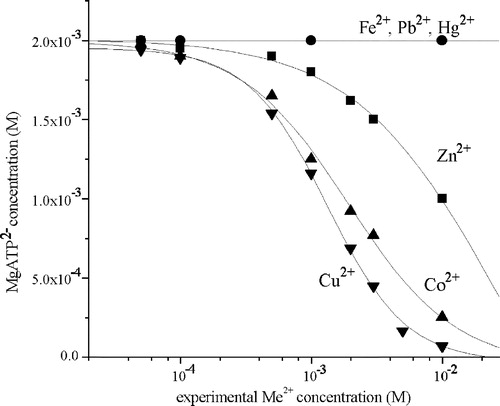
Table II. Inhibition of Na+/K+-ATPase and Mg2+-ATPase activity by simultaneous exposure to metal ions in mixtures.
Figure 2 Inhibition of Na+/K+-ATPase by Zn2+ in the absence (○) and presence of: 10 mM l-Cysteine (▪); 10 mM glutathione (▴) and 1 mM EDTA (•).
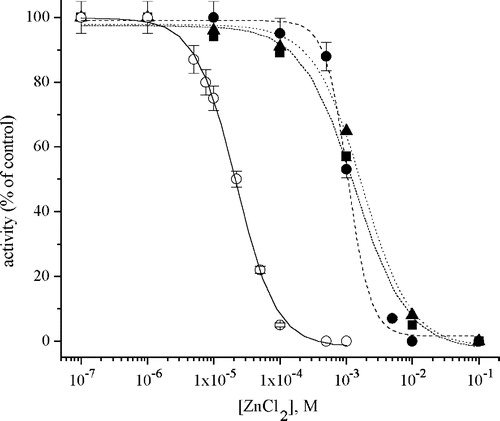
Figure 3 Inhibition of Na+/K+-ATPase by Hg2+ in the absence (○) and presence of: 1 mM EDTA (•); 10 mM l-cysteine (▪) and 10 mM glutathione (▴).
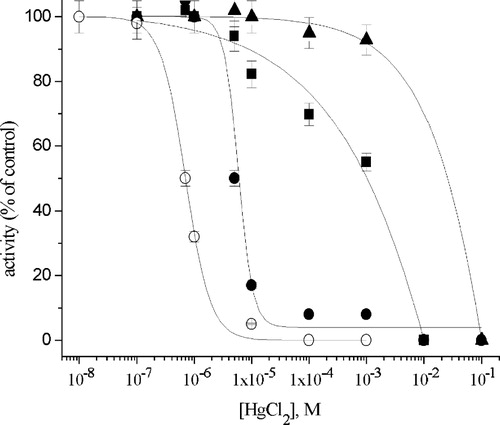
Figure 4 Effects of chelators: EDTA (•); l-cysteine (▪) and glutathione (▴) on the recovery of Na+/K+-ATPase activity in the presence of 1 × 10⁻⁴ M ZnCl2.
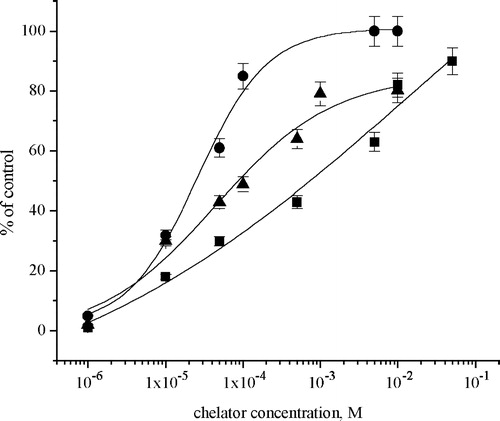
Table III. Kinetic analysis of Na+/K+-ATPase and Mg2+-ATPase activity in the absence (control) and presence of metal ions.
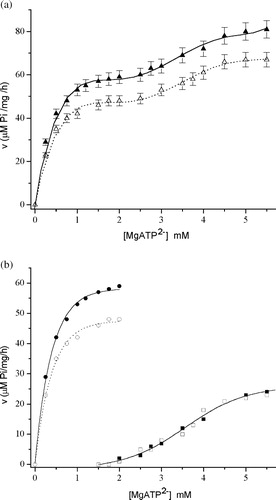
Figure 5 (a) The dependence of Mg2+-ATPase activity on MgATP2– in the absence (▴) and in the presence (Δ) of 15 μM ZnCl2. Symbols represent experimental points. (b) The Mg2+-ATPase theoretical kinetic curves (Mg2+-ATPase activity vs MgATP2 − concentration) of: “high affinity “Mg2+-ATPase subtype (○) in the absence of ZnCl2 (•) and in the presence of ZnCl2 (○); and “low affinity” Mg2+-ATPase subtype (squares) in the absence of ZnCl2 (▪) and in the presence of ZnCl2 (▪ or □).