Figures & data
Table I. Chemical structures and corresponding pIC50 values for a series of inhibitors of cruzain from Trypanosoma cruzi.
Figure 1. General scaffold of thiosemicarbazone and semicarbazone derivatives.
Figure 2. Distribution of pIC50 values for the data set compounds.
Table II. HQSAR analysis for various fragment distinctions on the key statistical parameters using fragment size default (4-7).
Table III. HQSAR analysis for the influence of different fragment sizes on the statistical parameters.
Table IV. Experimental and predicted activities (pIC50) with residual values for the test set inhibitors.
Figure 3. Plot of predicted values of pIC50versus the corresponding experimental values for the training (open squares) and test (solid circles) set inhibitors for the final HQSAR model.
Figure 4. HQSAR contribution map for the most potent cruzain inhibitor 11.
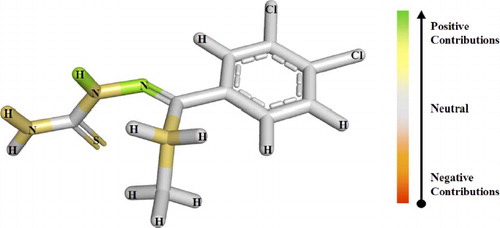
Figure 5. Plot of predicted values of pIC50versus the corresponding experimental values for the training (open squares) and test (solid circles) set inhibitors for the final classical QSAR model.
Figure 6. Descriptors score to regression vector.