Figures & data
Figure 1 General representation of the pharmacomodulation program.
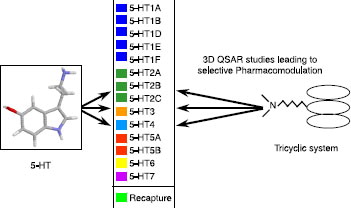
Figure 2 5-HT3 partial agonist pharmacophore.
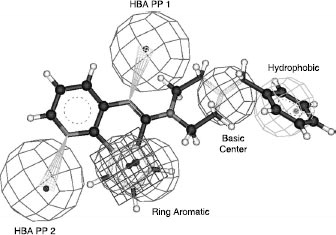
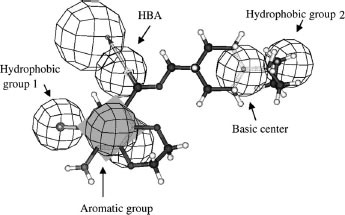
Figure 3 5-HT4 antagonist pharmacophore.
Scheme 1 Structures of compounds 1 and 2.
Figure 4 Frequencies vs Class (%/100) associated with the percentage of inhibition at 10− 6M.
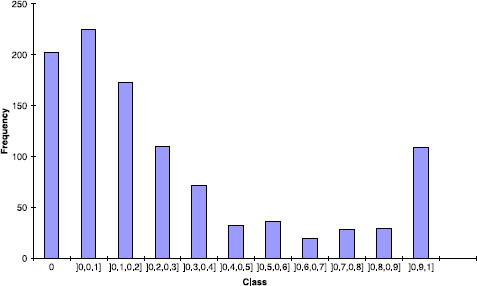
Table I. Dataset dissimilarity values.
Figure 5 Overall Density Neighbors density representation. (black: overall; green: actives-inactives; red: actives-actives; brown: inactives-inactives).
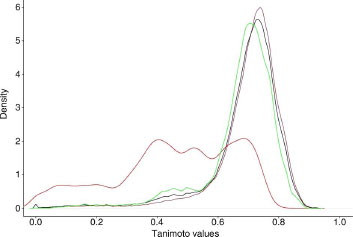
Figure 6 Evolution of the different indexes as a function of clustering level (Unity fingerprint/Tanimoto/Energy). (Pa curve in red, QCI curve in green; QCIW curve in blue).
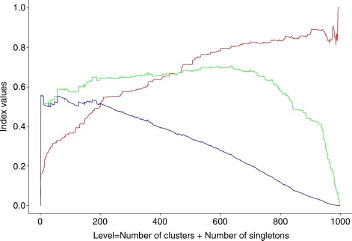
Table II. Classification of the hierarchies (the first twenty) as a function of QCIWD values.
Table III. Comparison as a function of QCIWD values.
Figure 7 Dendrogram associated corresponding to the best hierarchy based on pharmacophore fingerprint (Pfp_Jchem/Canberra/Energy). The numbers indicate the branches corresponding to active clusters (on the right of the number).
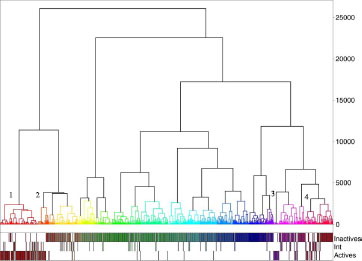
Figure 8 Dendrogram corresponding to the best hierarchy based on chemical fingerprint (Ufp_Unity/Tanimoto/Energy).
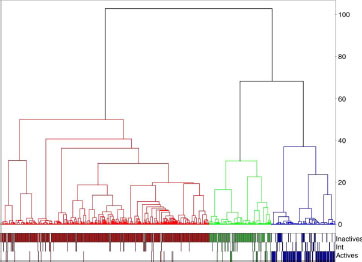
Table IV. Line up of active and inactive clusters as a function of the activity and fit values.
Table V. Percentage of compounds in active and inactive clusters in relation to fit towards the 3D pharmacophore.