
Figures & data
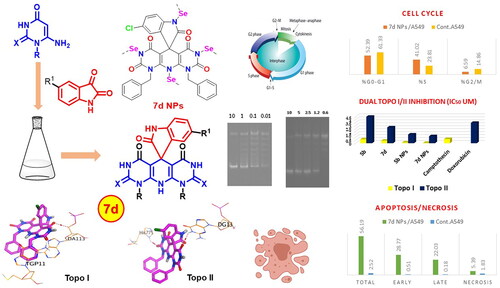
Figure 1. Chemical structures of some reported dual Topo I/II inhibitors.
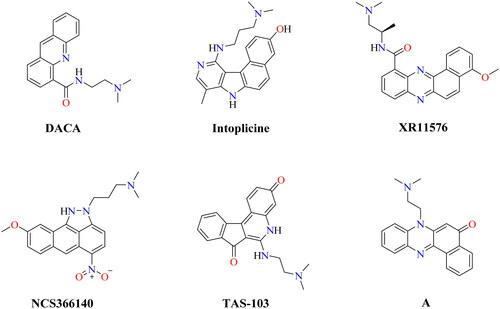
Figure 2. Strategy for building the target hybrids.
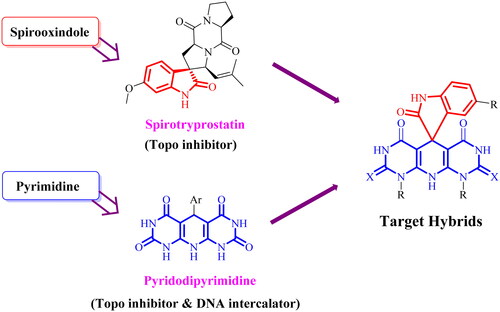
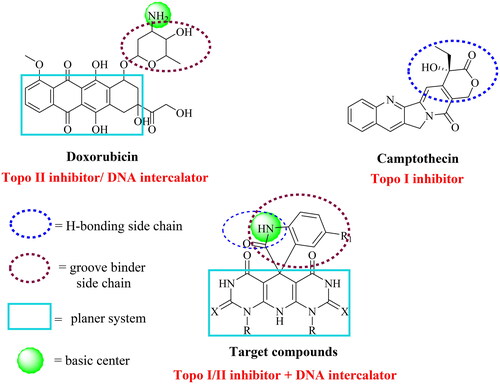
Figure 3. The molecular design rationale of the new DNA intercalating and Topo I/II inhibitors.
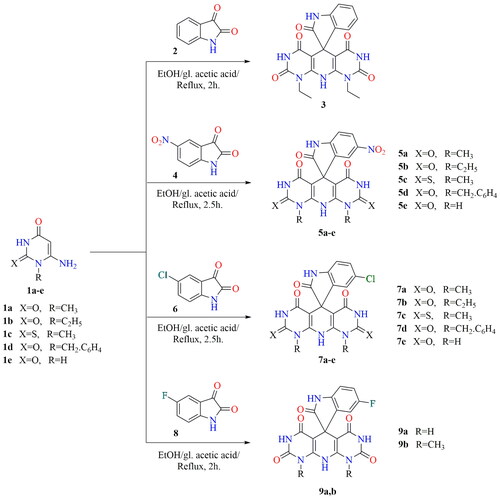
Scheme 1. Synthesis of spirooxindole compounds 3, 5a–e, 7a–e, and 9a,b.
Scheme 2. Mechanistic pathway for the synthesis of spirooxindole candidates.
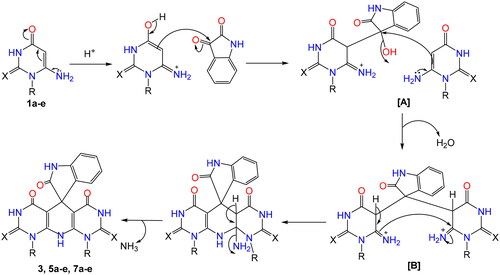
Figure 4. Chemical structures of heterocyclic-SeNPs (5b NPs and 7d NPs).
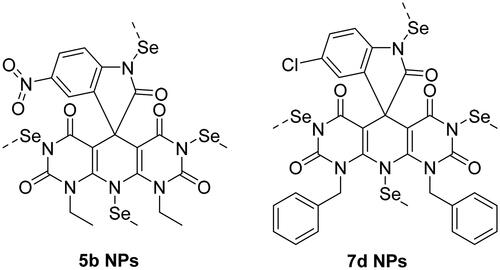
Figure 5. (A) Formation of NPs and (B) the UV–vis absorption spectrum of SeNPs.
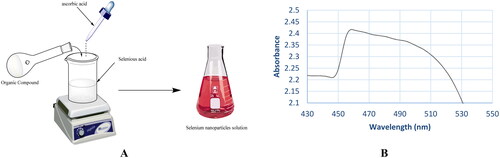
Figure 6. (A) TEM of SeNPs and (B) TEM of SeNPs loaded onto (5b and 7d).
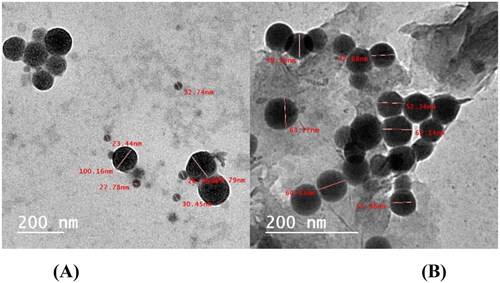
Figure 7. (A) Particle size from DLS of SeNPs and (B) particle size of SeNPs loaded onto (5b and 7d).
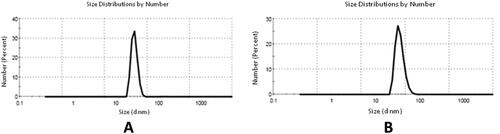
Table 1. The mean particle size of SeNPs.
Table 2. The IC50 of 3, 5a-e, 7a–e, and 9a,b compounds on five cancer cell lines and normal bone marrow cells (µg/mL).
Table 3. The IC50 of samples 5b NPs and 7d NPs on five cancer cell lines (µg/mL).
Figure 8. The mode of cell death of samples 5b NPs and 7d NPs on different cell lines. (A) The fluorescence stain using acridine orange/ethidium bromide stain. The photos show high early and late apoptotic changes with considerable necrotic changes. The scale bar is 50 µm and the magnification is ×20. (B) The % distribution of modes of cell death among different cell lines compared to their respective control cells.
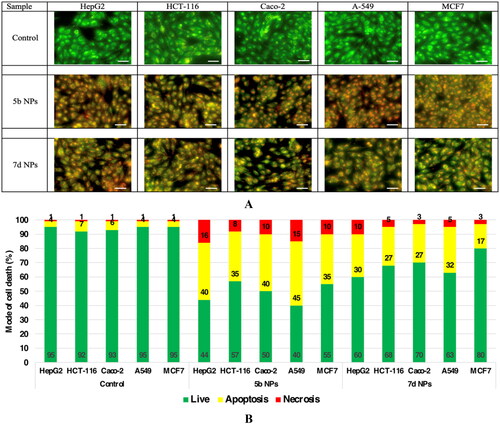
Figure 9. The mode of cell death of the most promising samples on different cell lines. (A) The fluorescing stain is acridine orange/ethidium bromide. The photos show high early and late apoptotic changes with considerable necrotic changes. The scale bar is 50 µm and the magnification is ×20. The % distribution of modes of cell death among different samples compared to their respective control cells in (B) HepG2, (C) A549, and (D) Caco-2.
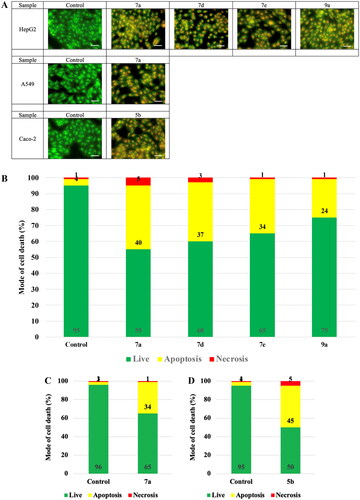
Figure 10. The inhibitory effects of the assessed compounds (5b, 7d, 5b NPs, and 7d NPs) against Topo I and Topo II compared to the reference drugs.
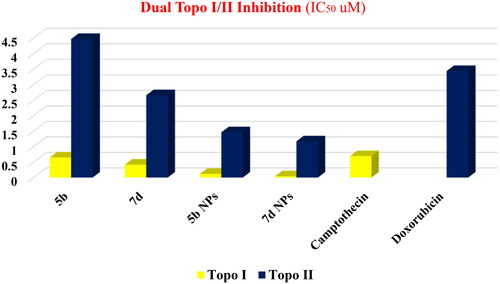
Figure 11. DNA-fragmentation gel images of the most active compounds (5b and 7d) and their nanoforms (5b NPs and 7d NPs) at various concentrations.
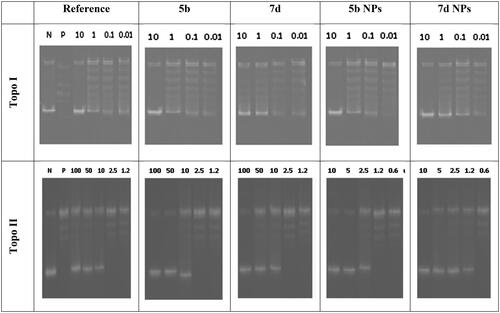
Figure 12. (A) Graphical representation for cell cycle analysis of 7d NPs treated A549; (B) the histograms show the distribution of cells treated with control (left side) and 7d NPs (right side).
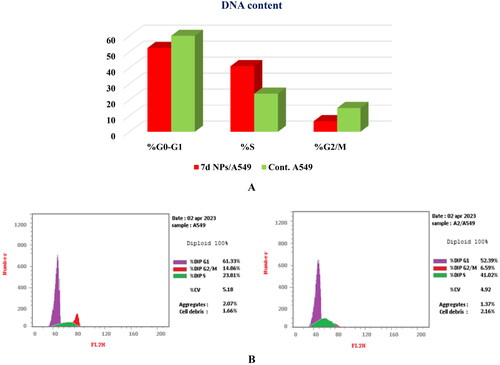
Figure 13. (A) Graphical representation for the % of apoptotic and necrotic cells among control (A549) and 7d NPs treated cells. (B) The representative histograms show the apoptosis induction of cells treated with control (left side) and 7d NPs (right side).
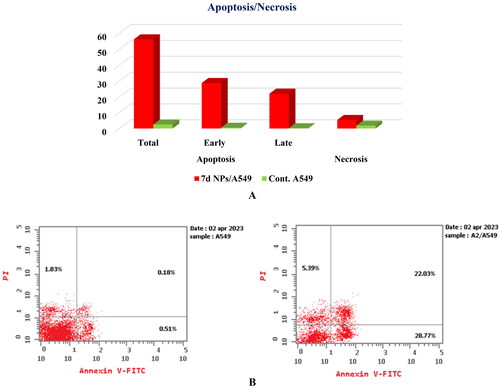
Figure 14. SAR of the tested compounds (3, 5a-e, 7a–e, and 9a,b).
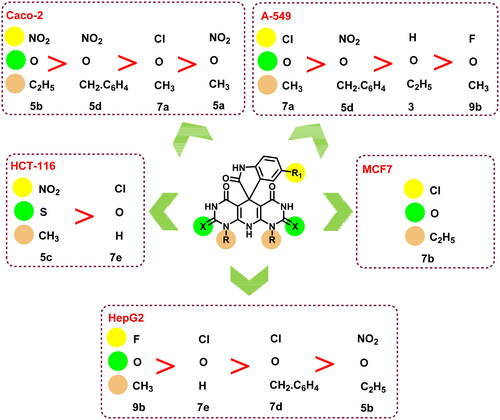
Table 4. 2D interactions, 3D interactions, and 3D positioning of 5b and 7d within the binding pockets of the human DNA in complex with Topo I (1T8I) and Topo II (3QX3) target receptors.