Figures & data
Figure 1. The TU-1000 skull simulator (left), shown alongside the commercially available SKS10 skull simulator (right) developed for use within a commercial hearing aid analyser in clinical practice.
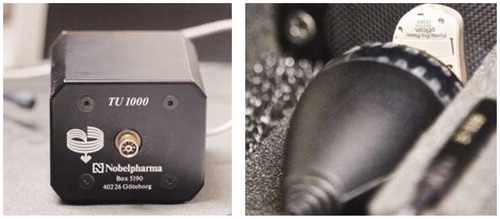
Table 1. Computational stages in the DSL v5.0 air conduction prescription, and adaptations within the DSL-BCD prescription.
Figure 2. Device-specific maximum output curves for six bone-anchored hearing instruments of varying makes, models and fitting ranges. All curves were measured with a 90 dB pure tone sweep, with output force levels (dB) measured on a TU-1000 skull simulator.
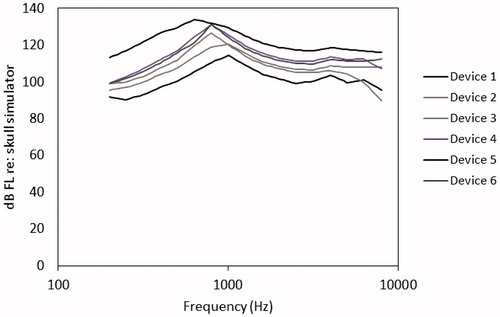
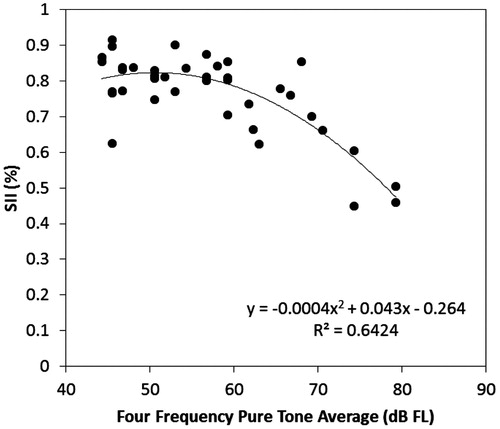
Figure 3. Panel a: A BCD fitting for an average patient, for DSL-BCD 1.0 and 1.1 targets. Panel b: The same display, for patient whose fitted device provided an unwanted resonant peak at 1000 Hz.
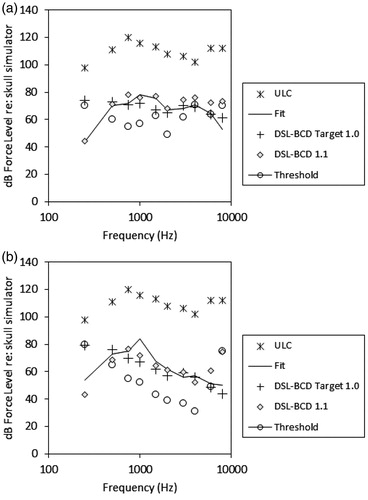
Figure 4. Aided Speech Intelligibility Index (SII) values for 39 patients who use bone conduction devices worn on an abutment. SII values are displayed as a function of the Four Frequency Pure Tone Average hearing threshold levels expressed as dB FL at the user’s abutment. A non-linear fitted trendline is also displayed (–).