Figures & data
Table 1. Pearson correlations between the three trait dimensions within each subpopulation, averaged across all included data sets. The three trait dimensions correspond to IOI-HA items Q(2,3,4,7), Q(5, 6) and Q(1).
Figure 1. Frequency distributions of raw ordinal responses to the seven IOI-HA items, summed across 13273 subjects in 11 included data sets.
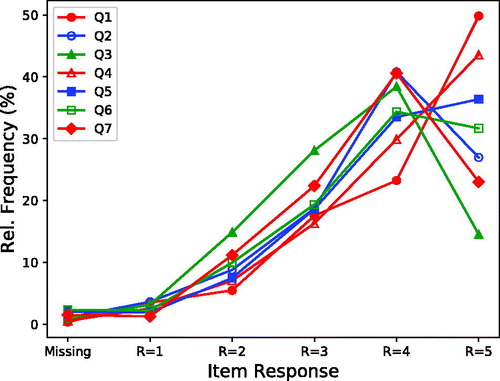
Figure 2. Response intervals as estimated by the IRT model for IOI-HA items. Values on the horizontal axis represent model trait values on the same interval scale for all IOI-HA items, and the plotted response thresholds indicate how trait values are mapped to discrete ordinal responses R = 1,…, 5 for each item. Each plotted response threshold is the model parameter τi,l defined in EquationEquation (1)(1)
(1) , estimated from responses by 13273 subjects in 11 included data sets.
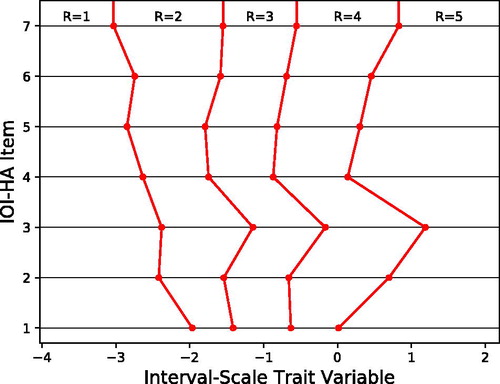
Figure 3. Scatter plot of individual overall raw IOI-HA scores (a) and overall re-scaled IOI-HA scores (b) versus the corresponding overall IRT-estimated trait values. A single trait value was calculated for each subject as the mean of the sampled posterior trait distribution. The raw scores have been slightly dithered around their integer values for clarity. The rescaled scores were estimated to place ordinal response values on the same interval scale for all items, as discussed in Section 3.3. Data are included for 13273 subjects in 11 data sets for which individual response data were available.
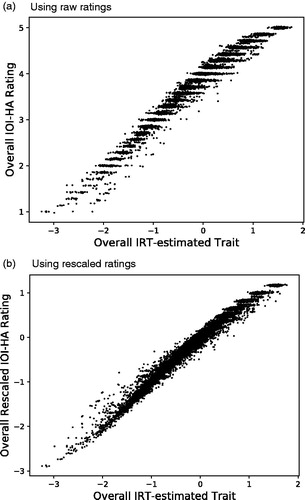
Table 2. Spearman rank correlations between conventional IOI-HA mean ratings and corresponding mean IRT-estimated trait values, for the N subjects in each group.
Table 3. Numerical values that might be used for recoding IOI-HA ordinal responses onto a single interval scale for all items.
Figure 4. Predictive distributions for three IRT-estimated mean trait values corresponding to IOI-HA items in populations represented by the 11 included data sets. The three separate trait dimensions correspond to subsets of IOI-HA items marked as Q(2,3,4,7), Q(5,6), and Q(1) on the horizontal axis. Symbols indicate medians (equal to means) and vertical lines show 90% symmetric credible intervals for the mean in each population. The right-hand vertical axis shows the trait values transformed back to raw ratings on the seventh “Quality of Life (QoL)” IOI-HA item.
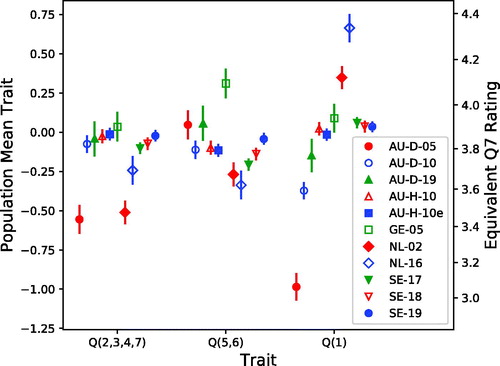
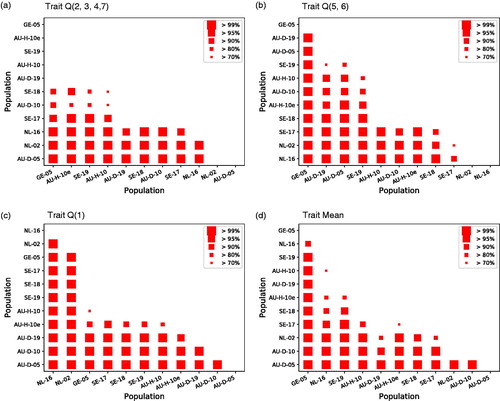
Figure 5. Jointly credible differences between predictive population means for the three IRT-estimated trait values shown in . The results for the overall trait mean (d) are calculated with equal weight for the three traits. Each square symbol indicates that the corresponding subpopulation identified on the horizontal axis has a higher mean than the one on the vertical axis. The symbol size indicates the joint credibility of all differences marked by the same or larger symbol. Note that the populations are ordered from greatest to least trait values, independently in each panel.