Figures & data
Table 1. Participant demographics.
Figure 1. Mean real ear aided response values for an input level of 65 dB SPL, comparing P1 and P2.
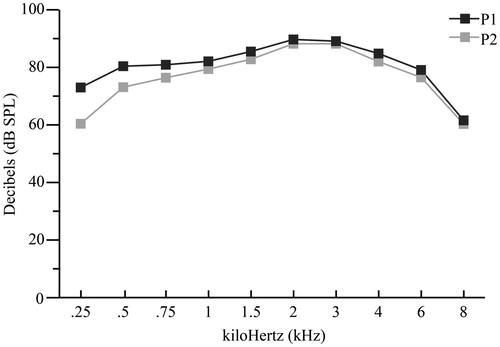
Figure 2. Illustration of the speech loudness and speech understanding rating scales and corresponding graphics.
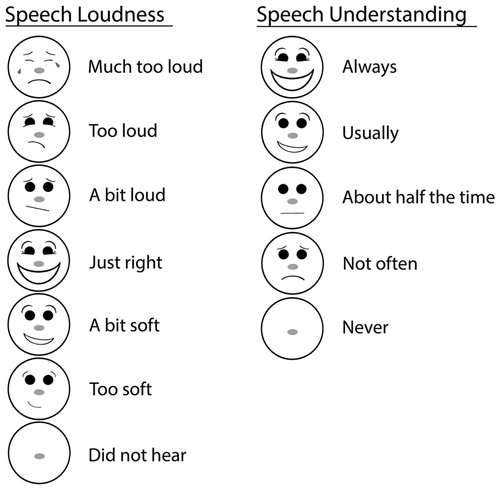
Table 2 The EMA Survey by Item Number, Description, Participant Facing Item, and Response Format
Figure 3. Proportion of listening situation ratings in P1 and P2. *indicates statistical significance, using a 95% criterion and n refers to the number of entries per hearing aid condition.
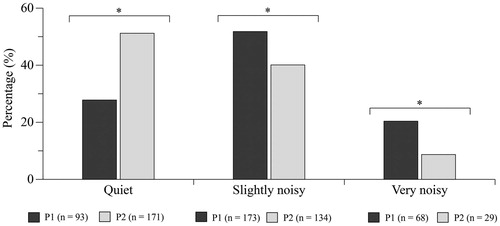
Figure 4. P1 versus P2 speech loudness ratings in each situation. *indicates statistical significance, using a 95% criterion and n refers to the number of entries per hearing aid condition.
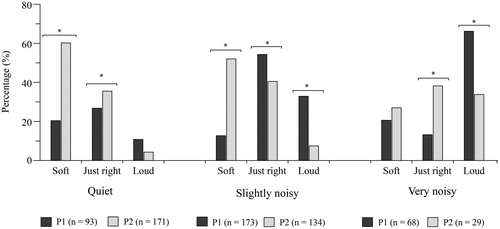
Figure 5. P1 versus P2 speech understanding ratings in each situation. *indicates statistical significance, using a 95% criterion and n refers to the number of entries per hearing aid condition.
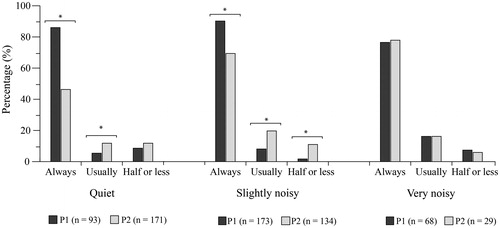
Figure 6. Program preference per situational noise level. *indicates statistical significance, using a 95% criterion and n refers to the number of entries per hearing aid condition.
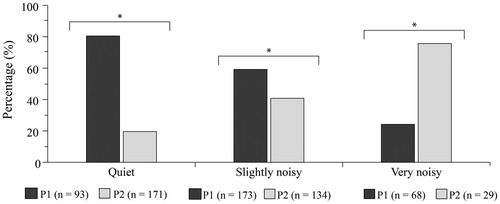
Table 3. Text based comments relating to program preference.
Figure 7. Program preference by hearing loss group (according to 4PTA value). *indicates statistical significance, using a 95% criterion and n refers to the number of entries per hearing aid condition.
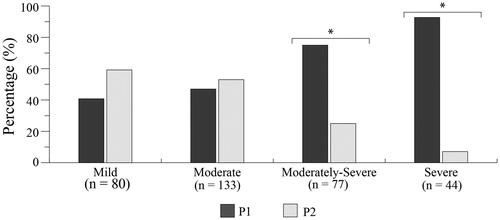
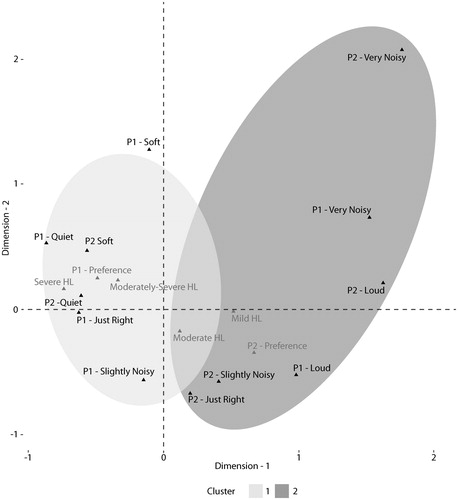
Figure 8. Variable categories projected to the first two dimensions. Categories of supplementary variables are depicted in a lighter grey font. The two clusters’ boundaries are superimposed on top of each other. HL denotes hearing loss and is displayed with a label of Mild, Moderate, Moderately-severe or Severe (according to 4PTA).