Figures & data
Figure 1. Listening-task performance in Experiment I and in Experiment II. Note. Listening-task performance in Experiment I (left panel) and in Experiment II (right panel) as a function of number of tasks (single listening-task vs. dual-tasking) and talkers’ auditory stimuli (co-located talkers vs. spatially separated talkers). Error bars represents the 95% confidence interval of the mean.
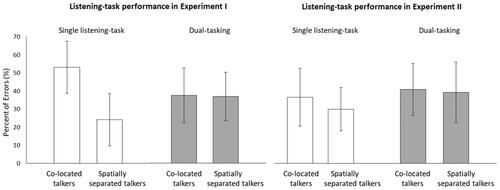
Figure 2. Number-judgement task performance in Experiment I. Note. Performance by means of reaction times (left panel) as a function of task conditions (single number-judgement task, co-located dual-tasking, spatially separated dual-tasking). Performance by number of correct trials worked out (right panel) a function of talkers’ auditory stimuli (co-located dual-tasking, spatially separated dual-tasking). Error bars represents the 95% confidence interval of the mean.
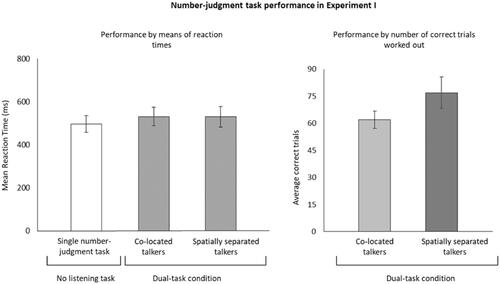
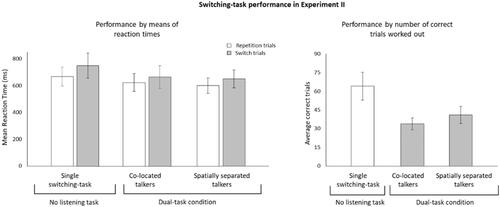
Figure 3. Switching-task performance in Experiment II. Note. Performance by means of reaction times (left panel) as a function of task conditions (single switching-task, co-located dual-tasking, spatially separated dual-tasking) and task switching (repetition trials, switch trials). Performance by number of correct trials worked out (right panel) as a function of task conditions (single switching-task, co-located dual-tasking, spatially separated dual-tasking). Error bars represents the 95% confidence interval of the mean.