Figures & data
Figure 1 Pressure–volume (P–V) relationships of the total respiratory system in health and in COPD. Tidal pressure–volume curves during rest (filled area) and exercise (open area) are shown. In COPD, because of resting and dynamic hyperinflation (a further increased EELV), exercise tidal volume (VT) encroaches on the upper, alinear extreme of the respiratory system's P-V curve where there is increased elastic loading. In COPD, the ability to further expand VT is reduced, i.e., inspiratory reserve volume (IRV) is diminished. In contrast to health, the combined recoil pressure of the lungs and chest wall in hyperinflated patients with COPD is inwardly directed during both rest and exercise; this results in an inspiratory threshold load on the inspiratory muscles. Abbreviations:EELV = end-expiratory lung volume EILV = end-inspiratory lung volume; RV = residual volume; TLC = total lung capacity.
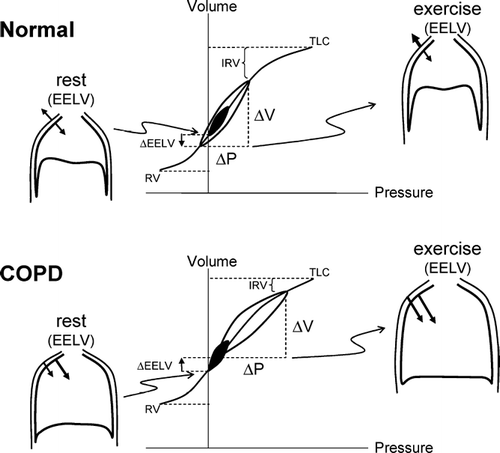
Figure 2 Changes in operating lung volumes are shown as ventilation increases with exercise in COPD (n = 105) and in age-matched normal subjects (n = 25). “Restrictive” constraints on tidal volume (VT, solid area) expansion during exercise are significantly greater in the COPD group from both below (reduced inspiratory capacity [IC]) and above (minimal inspiratory reserve volume [IRV], open area). Other abbreviations:EELV = end-expiratory lung volume; EILV = end-inspiratory lung volume; RV = residual volume; TLC = total lung capacity; VC = vital capacity. From reference 105, with permission.
![Figure 2 Changes in operating lung volumes are shown as ventilation increases with exercise in COPD (n = 105) and in age-matched normal subjects (n = 25). “Restrictive” constraints on tidal volume (VT, solid area) expansion during exercise are significantly greater in the COPD group from both below (reduced inspiratory capacity [IC]) and above (minimal inspiratory reserve volume [IRV], open area). Other abbreviations:EELV = end-expiratory lung volume; EILV = end-inspiratory lung volume; RV = residual volume; TLC = total lung capacity; VC = vital capacity. From reference 105, with permission.](/cms/asset/6a201c70-479e-490b-94cd-b9420d9efd07/icop_a_197648_uf0002_b.gif)
Figure 3 The distribution of the extent of change in inspiratory capacity (IC) during exercise is shown in moderate-to-severe COPD (n = 534). A reduction (negative change) in IC reflects dynamic hyperinflation (DH) during exercise. Each bar width corresponds to a change in IC range of 0.10 L. The majority of patients with COPD experienced significant DH during exercise. Graphs represent cumulative data from references 14, 19 and 20.
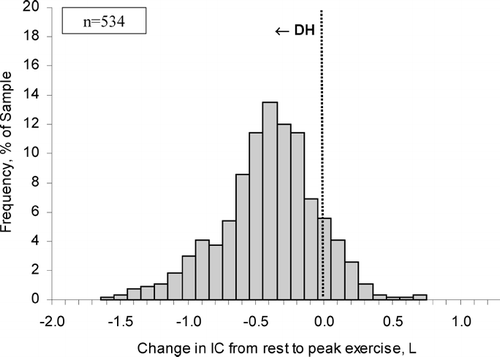
Figure 4 The mechanical threshold of dyspnea is indicated by the abrupt rise in dyspnea after a critical “minimal” inspiratory reserve volume (IRV) is reached which prevents further expansion of tidal volume (VT) during exercise. Beyond this dyspnea/IRV inflection point during exercise, dyspnea intensity, breathing frequency (F), and the ratio of respiratory effort (Pes/PImax) to tidal volume displacement [VT standardized as a % of predicted vital capacity (VC)] ratio all continue to rise. Arrows indicate the dyspnea/IRV inflection point. Values are expressed as means ± SEM. IC = inspiratory capacity. Modified from reference 56, with permission.
![Figure 4 The mechanical threshold of dyspnea is indicated by the abrupt rise in dyspnea after a critical “minimal” inspiratory reserve volume (IRV) is reached which prevents further expansion of tidal volume (VT) during exercise. Beyond this dyspnea/IRV inflection point during exercise, dyspnea intensity, breathing frequency (F), and the ratio of respiratory effort (Pes/PImax) to tidal volume displacement [VT standardized as a % of predicted vital capacity (VC)] ratio all continue to rise. Arrows indicate the dyspnea/IRV inflection point. Values are expressed as means ± SEM. IC = inspiratory capacity. Modified from reference 56, with permission.](/cms/asset/8fa07ae8-5af3-4127-92c0-e454bd8de0d7/icop_a_197648_uf0004_b.gif)
Figure 5 Magnitude of change in lung function parameters during recovery from exacerbation. (A) Representative flow-volume loops from a patient obtained at baseline (that is, before the exacerbation) and after onset of symptoms compatible with exacerbation. During exacerbation there is evidence of worsening expiratory flow limitation (EFL, arrow) resulting in hyperinflation with an increased end expiratory lung volume (EELV) and reduced inspiratory capacity (IC). (B) Change in lung function parameters during recovery from moderate exacerbations in 20 patients. Subjects were studied (day 0) within 72 hours of symptomatic deterioration. Data shown are change from initial (day 0) assessment. A bbreviations: FEV1 = forced expiratory volume in 1 second; FVC = forced vital capacity; IC = inspiratory capacity; SVC = slow vital capacity; FRC = functional residual capacity; RV = residual volume; TLC = total lung capacity. From reference 34, with permission.
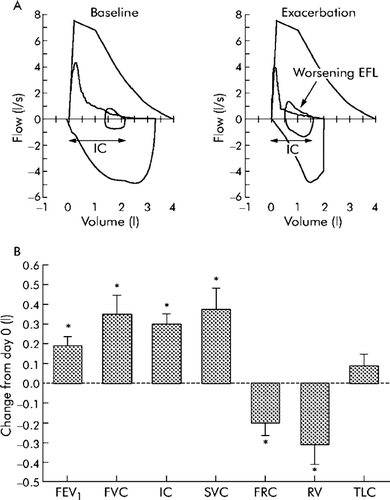
Table 1 Bronchodilator-induced changes in spirometric variables and resting lung volumes
Figure 6 Relationships between Borg ratings of dyspnea intensity and each of exercise time and inspiratory reserve volume (IRV) are shown during constant-load cycle exercise at 75% of each patient's maximum work rate after salmeterol (closed circles, solid lines) and placebo (open circles, dotted lines). Dypnea-IRV relationships were unchanged after salmeterol, with dyspnea increasing rapidly once a critically reduced IRV (shaded area) was reached which prevented further expansion of tidal volume. At isotime during exercise, measurements of inspiratory capacity and tidal volume increased significantly after salmeterol compared with placebo (* p < 0.05). Values are means ± SEM (points measured at rest, at standardized times during exercise, and at end-exercise). Adapted from reference 59, with permission.
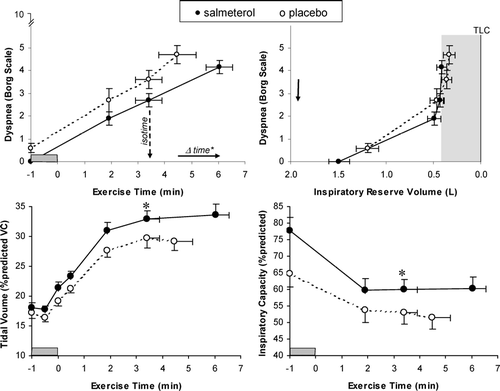
Figure 7 (A) Campbell diagrams are shown at a standardized time during constant-load exercise for a patient with severe COPD (FEV1 = 29 % predicted). After tiotropium compared with placebo, there were decreases in the inspiratory threshold load (ITL), the elastic work of breathing (shaded areas), and the resistive work of breathing (area within volume-Pes loops). Abbreviations: CLdyn = dynamic compliance, Cw = chest wall compliance, IC = inspiratory capacity, Pes = esophageal pressure. (B) The relationship between respiratory effort (Pes/PImax) and tidal volume displacement [VT standardized as a fraction of predicted vital capacity (VC)], an index of neuromechanical coupling, is shown during constant work rate exercise after tiotropium and placebo in patients with moderate to severe COPD (data from reference 56). Data from a group of age-matched healthy subjects during exercise is also shown (data from reference 50). Compared with placebo, tiotropium enhanced neuromechanical coupling throughout exercise in COPD. Values are means ± SEM.
![Figure 7 (A) Campbell diagrams are shown at a standardized time during constant-load exercise for a patient with severe COPD (FEV1 = 29 % predicted). After tiotropium compared with placebo, there were decreases in the inspiratory threshold load (ITL), the elastic work of breathing (shaded areas), and the resistive work of breathing (area within volume-Pes loops). Abbreviations: CLdyn = dynamic compliance, Cw = chest wall compliance, IC = inspiratory capacity, Pes = esophageal pressure. (B) The relationship between respiratory effort (Pes/PImax) and tidal volume displacement [VT standardized as a fraction of predicted vital capacity (VC)], an index of neuromechanical coupling, is shown during constant work rate exercise after tiotropium and placebo in patients with moderate to severe COPD (data from reference 56). Data from a group of age-matched healthy subjects during exercise is also shown (data from reference 50). Compared with placebo, tiotropium enhanced neuromechanical coupling throughout exercise in COPD. Values are means ± SEM.](/cms/asset/523ce2ba-3991-4037-a26d-ef88eca5792e/icop_a_197648_uf0007_b.gif)
Figure 8 Dyspnea, ventilation, breathing frequency (F), and operating lung volumes plotted against exercise time in patients randomized to breathe either room air (RA) or 60% oxygen. While breathing oxygen, exercise endurance increased significantly in conjunction with significant decreases in dyspnea, ventilation, F, end-expiratory lung volume (EELV, i.e., increased IC) and end inspiratory lung volume (EILV, i.e. increased IRV) at isotime during exercise (*p < 0.05, **p < 0.01). From reference 36, with permission.
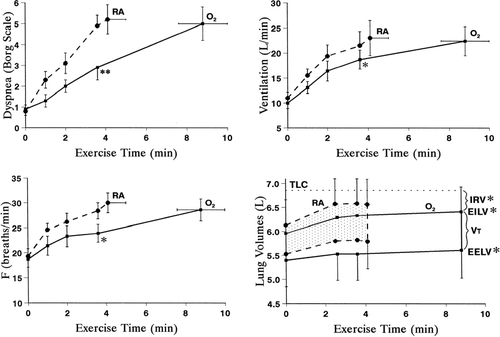
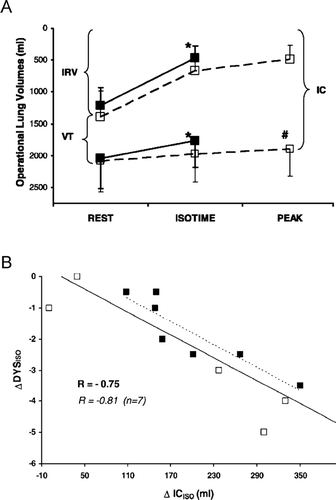
Figure 9 (A) Operating lung volumes during high intensity, constant work rate exercise are shown while breathing heliox (□) and air (▪) in 12 patients with COPD. At isotime during heliox breathing, inspiratory capacity (IC) and inspiratory reserve volume (IRV) increased significantly compared with air (* p < 0.01); at peak exercise on heliox, IC was significantly higher compared with air (#p < 0.01). VT = tidal volume. (B) The increase in IC at isotime during exercise correlated with the concurrent decrease in ratings of dyspnea intensity (r = − 0.75, p < 0.01). From reference 102, with permission.
