Figures & data
Table 1. Characterization of test AgNP in DI water and cell culture media.
Figure 1. Cell viability following exposure. (A) RAW 264.7 or (B) MPRO 2.1 cells were exposed to silver nanoparticles (AgNP) at 6.25, 12.5, 25, 50, or 100 μg/ml for 1, 6, 12, or 24 h before cell viability was assessed based on viable cell formation of formazan. Treatment of cells with hydrogen peroxide (10 mM) for 60 min was used as a positive control. Values shown are means ± SEM (N ≥ 3). *p < 0.05 vs. control group.

Figure 2. Silver nanoparticle uptake. RAW 264.7 or MPRO 2.1 cells were exposed to the AgNP (50 μg/ml) for 24 h. Particle uptake over the period was then quantified by inductively-coupled plasma mass spectrometry. Values shown are means ± SEM (N ≥ 3). *p < 0.05 vs. control.
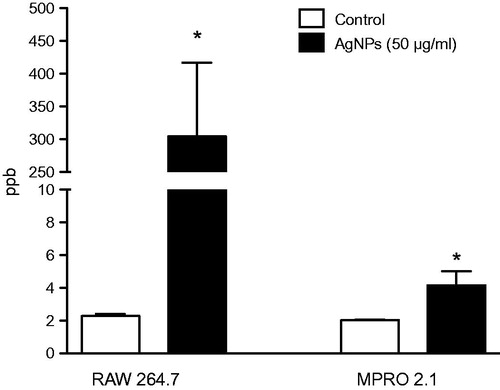
Figure 3. Reactive species generation, glutathione levels, and lipid peroxidation following exposure. (A) RAW 264.7 or (B) MPRO 2.1 cells were exposed to AgNP (50 μg/ml) for 0.25, 0.5, 1, 2, 6, or 24 h. At each timepoint, ROS generation was quantified based on fluorescence of cleaved H2DCFDA. (C) RAW 264.7 or MPRO 2.1 cells were exposed to AgNP (50 μg/ml) for 24 h and total glutathione levels were then measured by HPLC. (D) RAW 264.7 or MPRO 2.1 cells were exposed to AgNP (at 6.25, 12.5, 25, or 50 μg/ml) for 24 h and then lipid peroxidation (based on formation of 4-HNE) that had occurred in the cells was assessed by immunoblotting. Cells treated with 4-HNE (25 μM) for 1 h served as a positive control. Values shown are means ± SEM (N ≥ 3). *p < 0.05 vs. control.
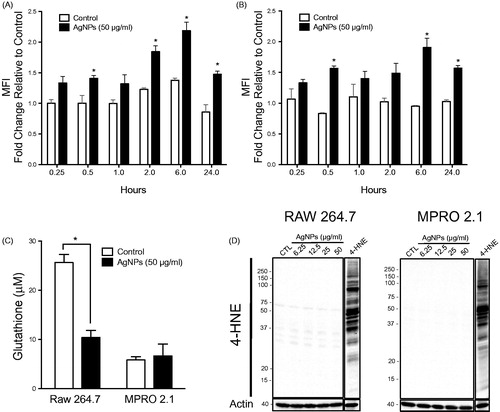
Figure 4. Inflammatory cytokine gene expression following exposure. RAW 264.7 or MPRO 2.1 cells were exposed to the AgNP (at 6.25, 12.5, or 25 μg/ml) for 6 hr. TNFα and IL-6 gene expression in the cells was then measured by real-time PCR. Values shown are means ± SEM (N ≥ 3). *p < 0.05 vs. control.
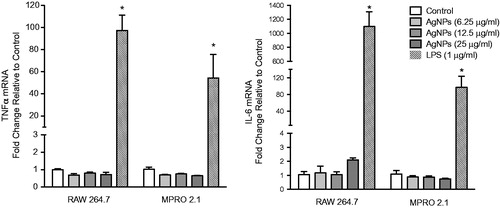
Figure 5. RAW 264.7 cell phagocytic ability as well as response to LPS following exposure. RAW 264.7 cells were exposed to the AgNP (50 μg/ml) for 24 h. After washing, the cells were then (A) exposed to latex beads coated with fluorescent-rabbit IgG for 4 h and uptake of beads were then measured in a flow cytometer or (B) challenged with 1 ng LPS/ml for 2 h and release of TNFα (left panel) and IL-6 (right panel) was subsequently evaluated (ELISA). Values shown are means ± SEM (N ≥ 3). *p < 0.05 vs. control. #p < 0.05 vs. LPS-only group.
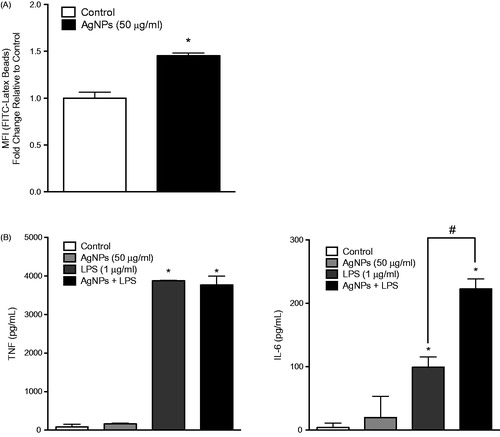
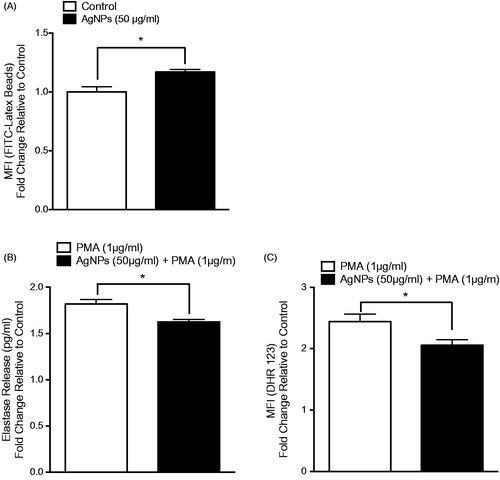
Figure 6. MPRO 2.1 cell phagocytic ability as well as response to PMA following exposure. MPRO 2.1 cells were exposed to the AgNP (50 μg/ml) for 24 h. After washing, the cells were then (A) exposed to latex beads coated with fluorescent-rabbit IgG for 4 h and uptake of beads was then measured in a flow cytometer, (B) challenged with 1 μg PMA/ml for 1 h after which neutrophil elastase release was measured (ELISA), or (C) challenged with PMA (1 μg/ml) for 15 min after which oxidative burst was subsequently evaluated (using fluorescent DHR 123 probe and flow cytometer). Values shown are means ± SEM (N ≥ 3). *p < 0.05 vs. control.