
Figures & data
Table 1. Comparison of discomfort sensations as reported by Petherbridge and Hopkinson (Citation1950) and the daylight glare index reported by Iwata et al. (1992).a
Fig. 1. Plan layout and photograph of the lighting chamber used in this study. Note that extraneous laboratory lighting (switched on for this photograph) was switched off during the tests, meaning that the room was dark other than the glare source, the VDU, and its surround.
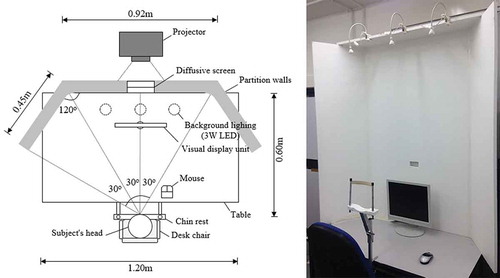
Fig. 2. Relationship between relative brightness function of the adjustment software and glare source luminance as measured from the location of the test participant using a Minolta LS-100 luminance meter.
Fig. 3. Examples of the visual tasks used in trials: (a) a circle and (b) an example row of pseudo-text. Note: these illustrations are not to scale.
Table 2. Source luminance settings at which category rating evaluations were given.
Fig. 4. Continuous scale used to evaluate the magnitude of discomfort due to glare. The descriptors above the line are those from Hopkinson’s multiple-criterion scale.
Fig. 5. Mean luminance at each discomfort sensation as determined using the luminance adjustment procedure. Error bars show the standard deviation.
Fig. 6. Mean GRV (IES-GI) and standard deviation for glare evaluations using the category rating procedure. Error bars show the standard deviation.
Table 3. Results of the Shapiro-Wilk test used to assess normality of data distributions. These data were the differences in evaluations between the two visual tasks.
Table 4. Bias-corrected and accelerated bootstrapped paired sample t-tests and effect sizes.a
Table 5. Errors in reading the pseudo-text.