Figures & data
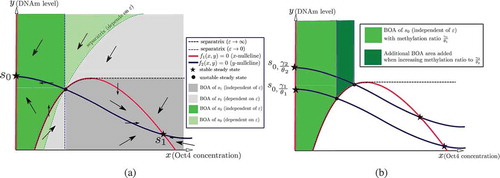
Figure 1. The DNA methylation cycle as currently understood [Citation31,Citation32]. (a) The TET-mediated cytosine DNA demethylation cycle starts with transferring a methyl group onto the C5 position of the cytosine to form 5-methylcytosine (5mC) by the DNA (cytosine-5)-methyltransferase (mainly DNMT3A/B for de novo methylation). The 5mC is then further iteratively oxidized by TET enzymes to form 5hmC, 5fC, and 5caC. The 5fC and 5caC are then recognized by TDG that yields an abasic site that is repaired by BER and returns to the unmodified cytosine state. (b) A simplified de-methylation cycle for Oct4 in the PSCC. Due to the fact that 5mC and 5hmC are two leading abundant oxidized forms of cytosine, we can effectively reduce the full cycle to a three state model
![Figure 1. The DNA methylation cycle as currently understood [Citation31,Citation32]. (a) The TET-mediated cytosine DNA demethylation cycle starts with transferring a methyl group onto the C5 position of the cytosine to form 5-methylcytosine (5mC) by the DNA (cytosine-5)-methyltransferase (mainly DNMT3A/B for de novo methylation). The 5mC is then further iteratively oxidized by TET enzymes to form 5hmC, 5fC, and 5caC. The 5fC and 5caC are then recognized by TDG that yields an abasic site that is repaired by BER and returns to the unmodified cytosine state. (b) A simplified de-methylation cycle for Oct4 in the PSCC. Due to the fact that 5mC and 5hmC are two leading abundant oxidized forms of cytosine, we can effectively reduce the full cycle to a three state model](/cms/asset/58e2fee3-147f-46b8-9629-7a7367b51ba2/kepi_a_1805686_f0001_oc.jpg)
Figure 2. A detailed diagram of the PSCC network showing N, T, O interactions. TET, Oct4, Nanog denote the unbound genes. *TET and *Oct4 denote NT binding to the respective promoter sites, TET* and Oct4* denote Oct4 bound to the respective promoter sites, and *TET*, *Oct4* denote both NT and Oct4 binding to the respective promoter sites. The black dashed line indicates binding locations of the Nanog-guided TET protein complex NT, while the blue dashed line indicates binding locations of Oct4. The coloured shaded area emphasizes the DNA demethylation cycle
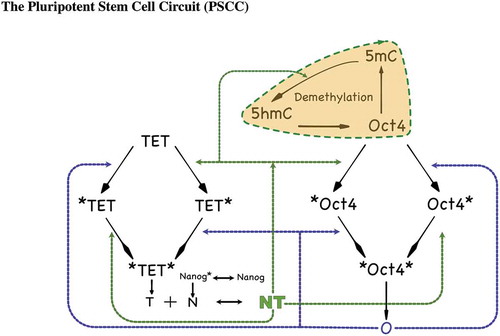
Figure 3. Graphical illustration of how a shift in the boundary separating two regions of attraction can result in phenotype switches under small perturbations. In the left panel, a perturbation of the silenced state leads to a transient configuration that belongs to the basin of attraction of the active steady state, resulting in a phenotype switch to the active steady state (i.e, the somatic state). In the right panel, the boundary has shifted, reflecting that fact that the relative sizes of the two basins of attraction have exchanged dominance. Now the same perturbation keeps the state in the domain of attraction of the silenced state, and the perturbed state eventually returns to that attractor. The shift in boundary could be due, for instance, to an increase in the methylation rate parameter
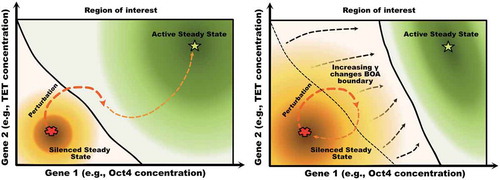
Figure 4. The two-pathway activation scheme for TF-gene binding. In the full model, such an activation scheme describes the promoter binding activation for both Oct4 and TET genes. Considering Oct4 as an example, there are two pathways for the activation of its promoter. Each of NT and Oct4 can independently bind to the promoter of Oct4. When both NT and Oct4 bind to the promoter region of the Oct4 gene, it will be activated
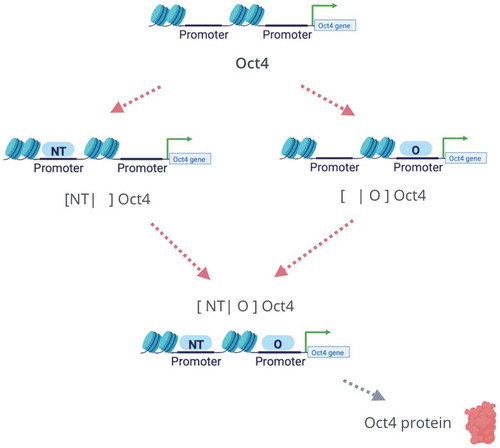
Figure 5. The diagram on the left shows how the triangle topology can be further simplified into a two-species CRN. Since the 5hmC methylation state has a slower dynamics compared to the 5mC methylation state, one may employ a quasi-steady states approximation to reduce the triangle topology to the two-state model depicted on the right
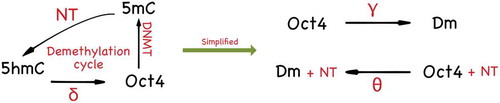
Table 1. The CRN model of the PSCC. Reactions have been grouped into eight modules and labelled from R1 to R18
Figure 6. The relative stability (measured by BoAp) of the silenced steady state increases with respect to the DNAm rate (). We show simulations for a representative set of different rates for the full model, where extensive simulations are shown in SI-
1.1. Each curve in the figure correspond to a particular set of parameters. Each curve ends when bistability is lost and BoAp jumps to 100%. This behaviour is illustrated in SI-
2.1. The simulations also show that, at small
region, the BoAp exhibits a sudden slowing down at around
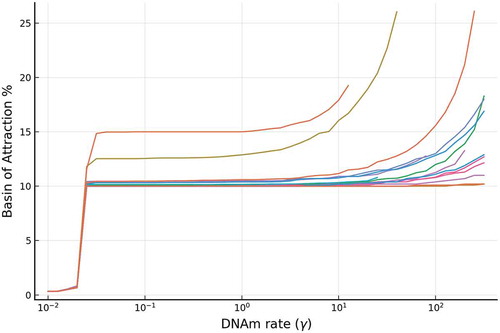
Figure 7. The relative stability (measured by BoAp) of the silenced state decreases with respect to the DNA demethylation rate (). Shown are a representative set of simulations for the full model, where extensive simulations are shown in SI-
1.1. Each curve in the figure corresponds to a particular set of parameters
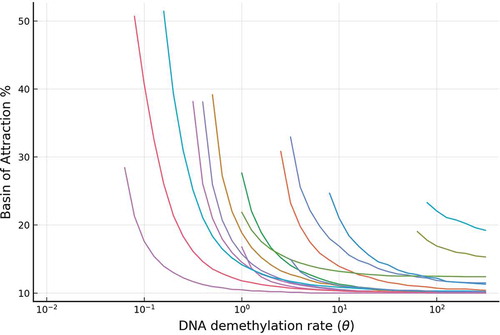
Figure 8. The BoAp of the silenced state shows a biphasic behaviour when the methylation cycle transitions from slow to fast, where R defined as the methylation association rate R = . The plot shows the BoAp while
is increased with a fixed methylation ratio, i.e.,
is increased so as to keep the ratio R constant. The system loses bistability when R exceeds 30. The kinetic rate parameters used are:
= 0.3,
= 0.2,
= 0.1,
= 1,
= 100,
= 100,
= 1,
= 1,
= 1,
= 1,
,
![Figure 8. The BoAp of the silenced state shows a biphasic behaviour when the methylation cycle transitions from slow to fast, where R defined as the methylation association rate R = γθ. The plot shows the BoAp while γ is increased with a fixed methylation ratio, i.e., θ is increased so as to keep the ratio R constant. The system loses bistability when R exceeds 30. The kinetic rate parameters used are: KO = 0.3, Knt = 0.2, Kd = 0.1, a= 1, ant = 100, aO = 100, αT = 1, αO = 1, αN = 1, δ = 1, R∈{0.01,0.1,1,10,20,30}, γ∈[10−2,102]](/cms/asset/1529f0d0-e244-4512-b69b-a4bd384c99ab/kepi_a_1805686_f0008_oc.jpg)
Figure 9. Phase plane analysis of the two-dimensional model (11). (a) The directions of the vector field and the BoAs in the case of bistability with stable steady states , where
denotes the silenced steady state and
denotes the active steady state. The arrows in each region denote the direction of the vector field. (b) The area of the
-independent BoA of the silenced steady state
increases when the methylation ratio increases. Recall that
denotes the case of a slow methylation kinetics (relative to protein kinetics), while
denotes the case of fast methylation kinetics