Figures & data
Figure 1. Flowchart of the study population: inclusions and exclusion.
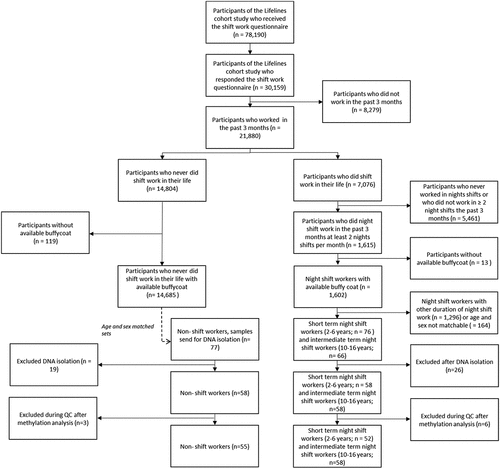
Table 1. Characteristics of the study population.
Figure 2. Manhattan plots depicting p-value for comparisons between groups in men (a) and women (b) per CpG site. Red line indicates p value of 9 *10−8 and blue line indicates p = 0.0005.
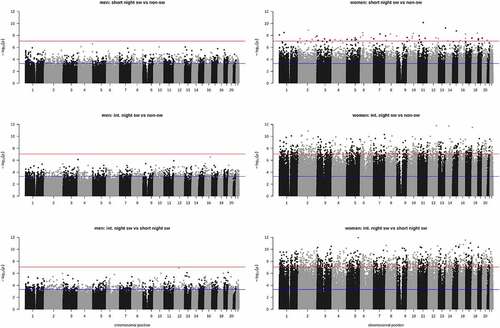
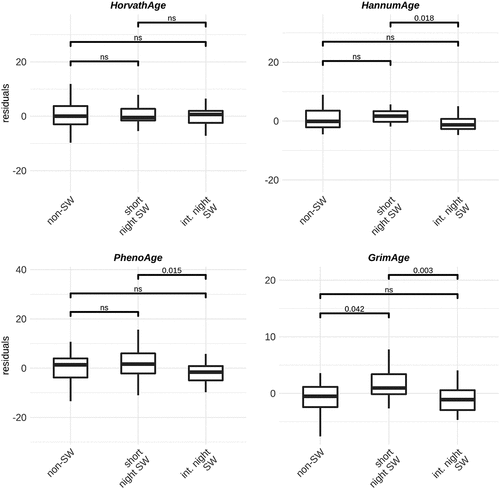
Figure 3. Boxplots of age acceleration residuals in male non-shift workers (n = 31), short term shift workers (n = 28) and intermediate term shift workers (n = 32) using four different models: Horvath Hannum, PhenoAge and GrimAge.
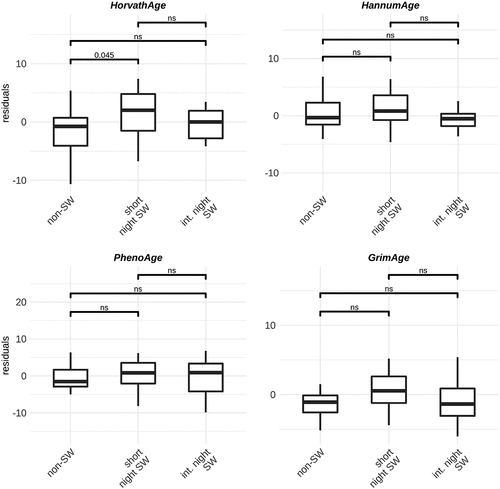
Figure 4. Boxplots of age acceleration residuals in female non-shift workers (n = 24), short term shift workers (n = 24) and intermediate term shift workers (n = 26) using four different models: Horvath Hannum, PhenoAge and GrimAge.