
Figures & data
Figure 1. The individual and combined effects of TiO2 NPs and UV-B irradiation on (A) shoot fresh weight, (B) shoot dry weight, (C) root fresh weight, and (D) root dry weight in rice seedlings. Data presented are the means ± SE (n = 8), and significant differences between the means were calculated at p ≤ 0.05 using Duncan’s multiple range test.
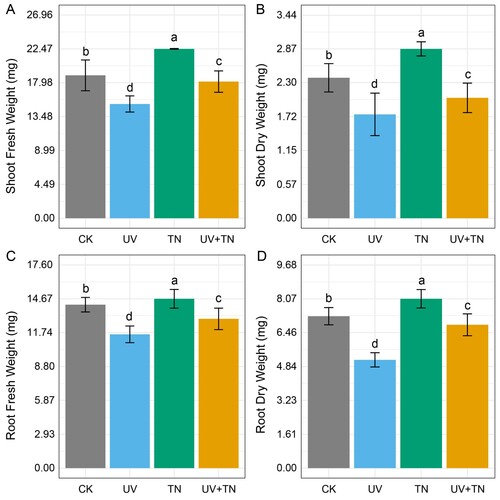
Figure 2. The individual and combined effects of TiO2 NPs and UV-B irradiation on (A) chlorophyll a (Chla), (B) chlorophyll b (Chlb), (C) total chlorophyll (TChl), and (D) carotenoids (Car) in rice seedlings. Data presented are the means ± SE (n = 8), and significant differences between the means were calculated at p ≤ 0.05 using Duncan’s multiple range test.
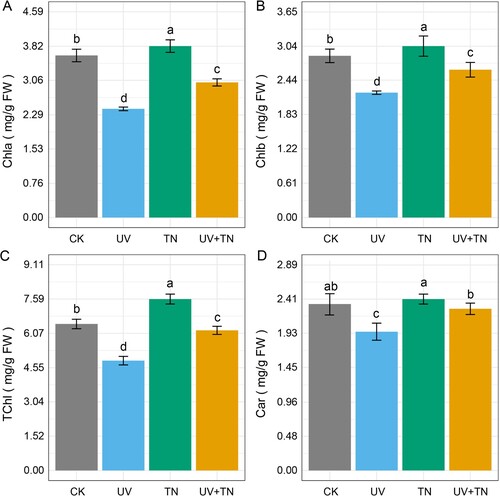
Figure 3. The individual and combined effects of TiO2 NPs and UV-B irradiation on key photosynthetic parameters including (A) net photosynthetic rate (Pn), (B) stomatal conductance (Gs), (C) maximum efficiency of photosystem II (Fv/Fm), and (D) non-photochemical quenching (NPQ) in rice plants. Data represented are the means ± SE (n = 8), and significant differences between the means were calculated at p ≤ 0.05 using Duncan’s multiple range test.
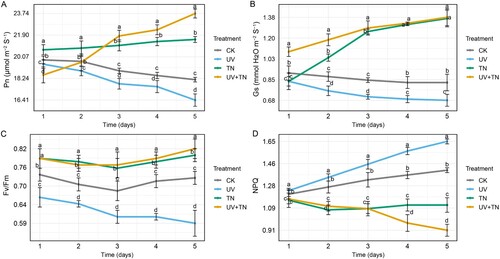
Figure 4. The individual and combined effects of TiO2 NPs and UV-B irradiation on important biochemical parameters including (A) Ribulose-1,5-bisphosphate carboxylase/oxygenase (Rubisco), (B) fructose-1,6-bisphosphatase (FBPase), (C) soluble sugar, and (D) soluble protein in rice plants. The values represented are the means ± SE (n = 8), and significant differences between the means were calculated at p ≤ 0.05 using Duncan’s multiple range test.
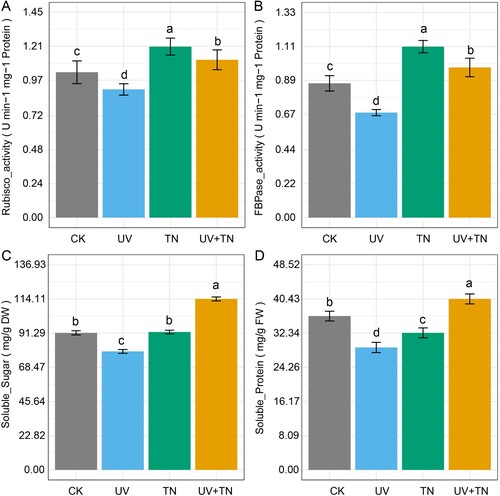
Figure 5. The individual and combined effects of TiO2 NPs and UV-B irradiation on oxidative stress, and antioxidant system in rice seedlings. (A) The contents of hydrogen peroxide (H2O2), (B) superoxide anion (O2•−), (C) AsA, (D) GSH, (E) GSSG, and (F) GSH/GSSG ratio in rice plants. The values represented are the means ± SE (n = 8), and significant differences between the means were calculated at p ≤ 0.05 using Duncan’s multiple range test.
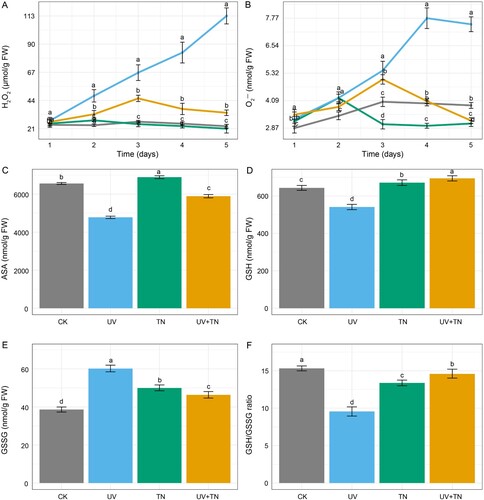
Figure 6. The overview of transcriptome analysis in different comparison groups. (A) Sample to sample clustering analysis for checking batch effects and their similarity, (B) Principle component analysis (PCA) for gene expression pattern, (C) the number of up-regulated and down-regulated genes among the different comparison groups (UV vs. CK, TN vs. CK, UV+TN vs. CK) (D) Volcano plots for all the expressed genes in the three comparison groups, (E) Venn diagram of the identified up-regulated DEGs in three comparison groups describing unique and common DEGs in different treatments, (F) Venn diagram of the identified down-regulated DEGs in three comparison groups describing unique and common DEGs in different treatments.
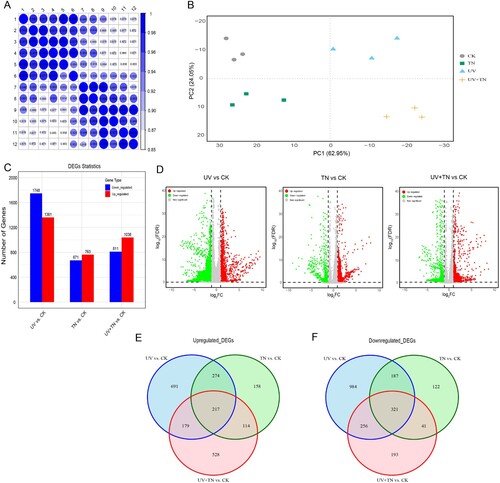
Table 1. The sequencing statistics of 12 RNA libraries in this study.
Figure 7. Gene Ontology (GO) enrichment analysis of up- and down-regulated DEGs involved in biological processes, cellular components, and molecular functions in different comparison groups. (A-B) top 20 GO enrichment terms of upregulated and downregulated DEGs in the UV vs. CK comparison group, (C-D) top 20 GO enrichment terms of upregulated and downregulated DEGs in the TN vs. CK comparison group, (E-F) top 20 GO enrichment terms of upregulated and downregulated DEGs in the UV+TN vs. CK comparison group.
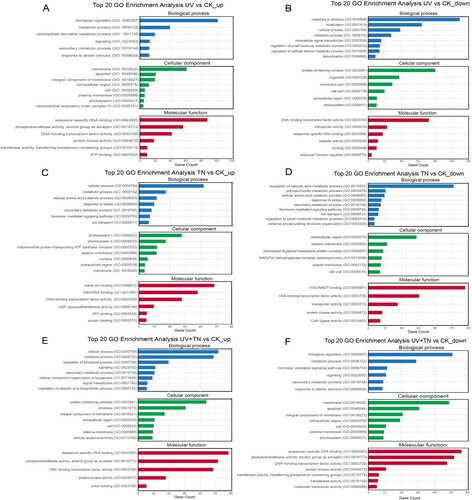
Figure 8. Kyoto Encyclopedia of Genes and Genomes (KEGG) pathways annotation and top 20 KEGG enrichment terms that reflects the involvement of number of DEGs (up- and down-regulated) in orchestrating various functions in rice. (A-B) top 20 KEGG enrichment terms of upregulated and downregulated DEGs in the UV vs. CK comparison group, (C-D) top 20 KEGG enrichment terms of upregulated and downregulated DEGs in the TN vs. CK comparison group, (E-F) top 20 KEGG enrichment terms of upregulated and downregulated DEGs in the UV+TN vs. CK comparison group.
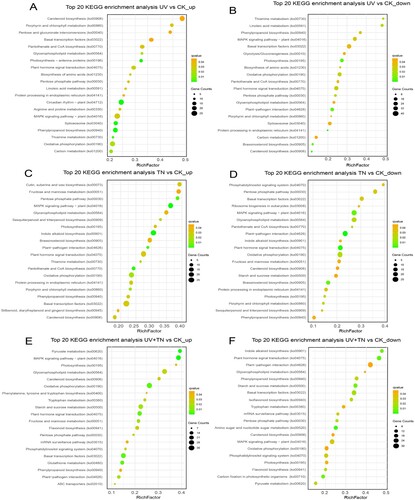
Figure 9. Heatmap visualization of DEGs in the three comparison groups (UV vs. CK, TN vs. CK, UV+TN vs. CK) associated with (A) transcription factors, (B) oxidative stress and antioxidant system, (C) cell wall biosynthesis, (D) hormone regulation and (E) MAPK signaling. A decrease and an increase in transcript abundance relative to control samples were shown in red and blue signals, respectively.
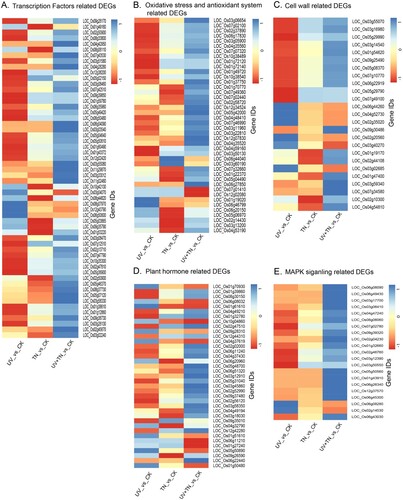
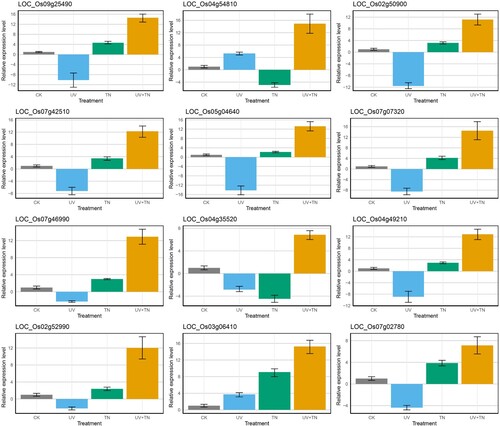
Figure 10. The qRT-PCR based expression pattern of the 12 selected DEGs from RNA-Seq data obtained from samples (CK, UV, TN, UV+TN) after treatment. The data are represented as mean ± SD of three biological replicates.
Supplemental Material
Download Zip (167.9 KB)Data availability statement
The original contributions presented in this study are included in the article/supplementary material, further inquiries can be directed to the corresponding author.