
Figures & data
Table 1. Overview of selected physicochemical characteristics of the studied MWCNT and reference materials.
Table 2. Pearson’s Correlations of physicochemical parameters.
Figure 1. H&E stained histopathological lung sections of mice exposed to 0 or 54 μg MWCNT. (A–F) Representative images of the most predominant histological changes. (G–L) Representative images of Group I MWCNT on day 28 (G–I) and 92 (J–L). Lymphocytic aggregates (Lycy) and foreign material-containing alveolar macrophages where found in all groups of mice exposed to 54 μg MWCNT and are commonly marked with blue and red arrows, respectively, across all images. Objectives are 10× unless otherwise stated. (A) Negative control on day 92. (B) NRCWE-041 on day 92. MWCNT are mainly localized in alveolar macrophages (red arrows). Objective 20×. (C) NRCWE-040 on day 92. Non-dust granuloma (black arrow). Non-collagenous, slight thickening of alveolar ducts and alveolar walls, with hyperplasia of type II cells (green arrows). Objective 20×. (D) NRCWE-040 on day 92. Small CNT-laden (foreign body) granulomas (black arrow). Small perivascular Lycy (blue arrow). (E and F) NRCWE-045 on day 28. Small area of perivascular Lycy (blue arrows). Focal alveolitis (green arrows). For image E the objective was 2×. (G) NRCWE-040 on day 28. (H) NRCWE-041 a on day 28. Slight focal alveolitis, with inflammatory cells and debris in alveoli (green arrow). (I) NRCWE-042 on day 28. (J) NRCWE-040 on day 92. (K) NRCWE-041 on day 92. (L) NRCWE-042 on day 92.
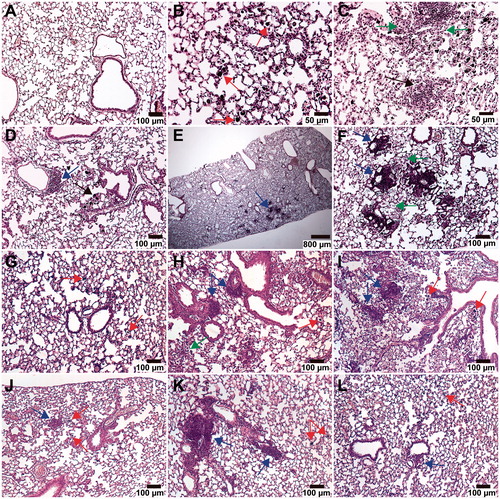
Figure 2. Total number of neutrophils in the BAL fluid after exposure to MWCNT and reference materials. Error bars indicate SD. (A) Day 1. (B) Day 28. (C) Day 92. *p < 0.05, **p < 0.01, ***p < 0.001 compared to vehicle controls. †: 54 > 6 μg/ml; ‡: 54 > 6 and 18 μg/ml; x: 18 > 6 μg/ml; ^: higher than the –OH form; ♦: higher than Group I; ♠: higher than Group II; ♣: higher than Group III.
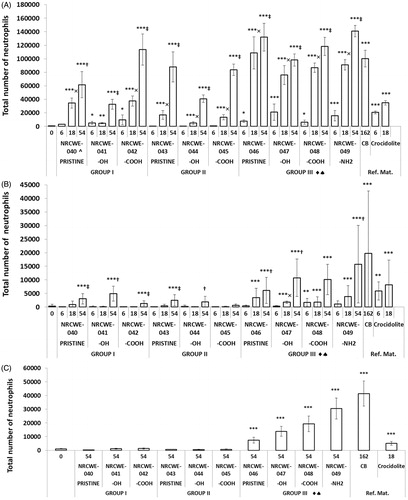
Figure 3. The relationship between total number of neutrophils in the BAL fluid and the total instilled surface area on day 1. Individual data points are the average total neutrophil numbers for each exposure group. The linear relationship, the R2 and the p value for the correlation are shown for all correlations. (A) All MWCNT types and doses. (B) All MWCNT types at dose 6 μg/mouse. (C) All MWCNT types at dose 18 μg/mouse. (D) All MWCNT types at dose 54 μg/mouse.
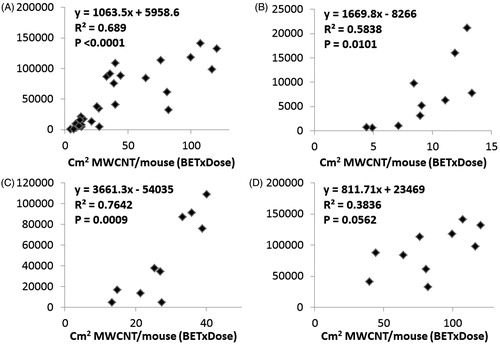
Table 3. Multiple regression analyses of MWCNT physicochemical properties as predictors of neutrophil influx and DNA damage.
Figure 4. DNA strand breaks in the lung tissue after exposure to MWCNT and reference materials. Error bars indicate SD. (A) Day 1. (B) Day 28. (C) Day 92. *p < 0.05, ***p < 0.001 compared to vehicle controls. #: higher than the pristine form; ♦: higher than Group I; ♣: higher than Group III.
