
Figures & data
Table 1. Physico-chemical properties of the particles.
Figure 1. Transmission electron microscopy images of the amorphous SiNP particles. The images of (A) SiNP (10–20 nm), (B) SiNP (5–15 nm) and (C) SiNP (12 nm) are presented. Scale bars are indicated in the lower left corner of each image.
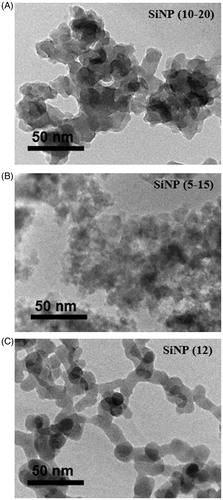
Figure 2. Cytotoxic profile of three mammalian cell lines exposed to 3, 10, 30 and 100 μg/cm2 of the particles for 24 h. The A549, THP-1 and J774A.1 cell lines were exposed to SiNPs and SRMs (24 h). An integrated bioassay was performed comprising of (A) ATP assay, (B) LDH assay (release), (C) CTB assay and (D) BrdU ELISA. (A) Three-way ANOVA, two-way interactions: Cells × PM, Dose × PM, Dose × Cells, p < 0.001, Tukey comparisons: (a) cells treated with SiNP (5–15 nm), A549 vs J774A.1 and A549 vs THP-1, p < 0.001, (b) cells treated with SiNP (10–20 nm), A549 vs J774A.1 and A549 vs THP-1, p < 0.001, (c) cells treated with SiNP (12 nm), A549 vs J774A.1 and A549 vs THP-1, p < 0.001, (d) dose for SiNP (5–15 nm), 100 μg/cm2 different from all other doses, p < 0.001, (e) dose for SiNP (10–20 nm), 100 μg/cm2 different from all other doses, p < 0.001, (f) dose for SiNP (12 nm), 100 μg/cm2 different from all other doses, p < 0.035, (g) dose in A549 cells, 100 μg/cm2 different from all other doses, p < 0.012, (h) dose in A549 cells, 100 μg/cm2 different from all other doses, p < 0.001, (i) dose in A549 cells, 100 μg/cm2 different from all other doses, p < 0.001; (B-C) Three-way ANOVA, three-way interaction: Dose × Cells × PM, p < 0.001; (D) Three-way ANOVA, three-way interaction: Dose × Cells × PM, p < 0.05; (B–D) Asterisks indicate effects significantly different from 0 μg dose cells, Tukey comparisons, *p < 0.05, **p < 0.001; (D) BrdU ELISA was not available for differentiated THP-1 cells. Data were expressed as mean fold-effect (FE) ± SEM for n = 3 independent experiments, with three technical replicates within each experiment.
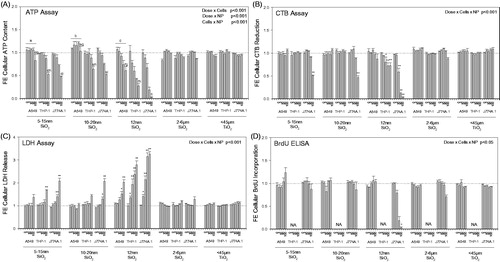
Figure 3. Secretory cytokine profiles of cells exposed to particles. Hierarchical cluster analysis and heatmap of statistically significant cytokines by ANOVA (p < 0.05), fold changes in abundance of secretory cytokines in each cell line are presented: (A) A549, (B) J774A.1 and (C) THP-1. All treatments were expressed relative to an untreated control (fold-effect) and adjusted for consensus (average across assays) cytotoxic response at each particle dose level (30 and 100 μg/cm2). The dataset was log(2) transformed. The bar illustrates the color coding for the cytokines produced by the cells exposed to SiNPs and SRMs. Green indicates decreased cytokine production and red indicates increased cytokine production relative to control groups. The vertical dendrogram represents the clustering of cytokines/chemokines and the horizontal dendrogram represents the clustering of particles. The analysis was based pooled samples of 2–3 wells per sample within each experiment conducted in triplicate experiments (n = 3).
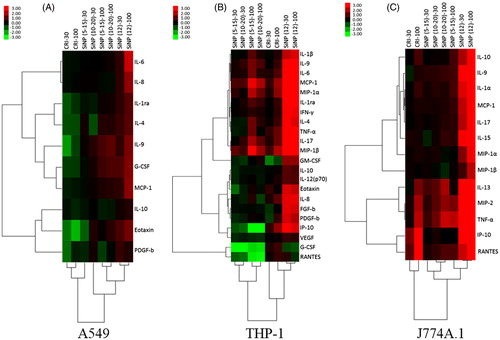
Figure 4. Cytokine drivers of particle effects in A549, THP-1 and J774A.1 cell lines. Principal component analysis was conducted to identify the principal components that explain majority of the variability in the dataset. The cytokine data from cell exposures to particles (30, 100 μg/cm2) were expressed as fold-effect over control, adjusted for cytotoxicity and log(2) transformed. The bi-plot is a combination of the score plot which shows the score of each PC for each particle observation and the loading plot which shows the load of each cytokine on the identified PC. The letters A, J and T in brackets following the cytokines abbreviate A549, J774A.1 and THP-1 cells, in which the specific analyte was assessed.
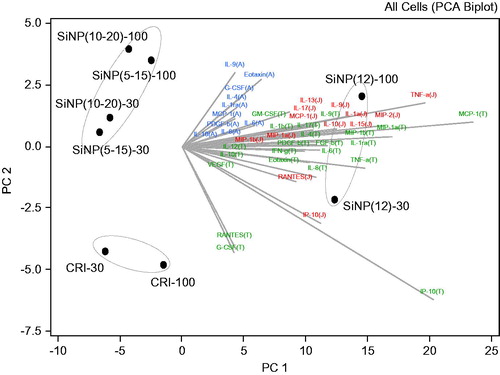
Figure 5. (A) Plot showing the distribution of the particles based on their cytotoxic potency (βV) as measured by CTB, ATP and LDH assay (cell content), with a left to right and top to bottom direction of increasing potency. Three-way ANOVA, PM main effect, p < 0.001, SiNP (12 nm) vs. SiNP (10–20 nm), SiNP (5–15 nm), SiO2 and TiO2, p < 0.001; SiNP (5–15 nm) vs. SiO2 and TiO2, p < 0.05; Cells main effect, p < 0.001, A549 vs. J774A.1 vs THP-1, p < 0.001; Assay main effect, p = 0.004, CTB vs ATP, LDH, p < 0.05; (B) Plot showing the association of the consensus biological reactivity (βR; average of absolute values of cytotoxic potency) and consensus inflammatory potency (βI-V; average of cytokine potency) of the particles in A549, J774A.1 and THP-1 cells with a right to left and bottom to top direction of increasing potency. Three-way ANOVA, PM main effect, p < 0.001, SiNP (12 nm) vs. SiNP (10–20 nm), SiNP (5–15 nm) and SiO2, p < 0.001; Cells main effect, p < 0.001, A549 vs. J774A.1, p < 0.001, THP-1 vs. J774A.1, A549, p < 0.05; Potency Estimate, p = 0.064, not significant.
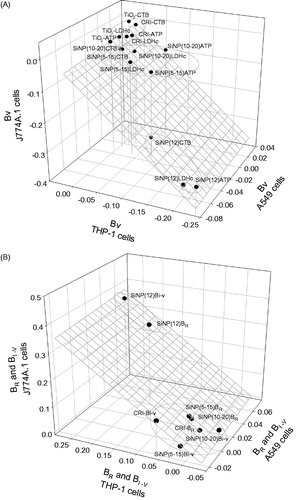
Table 2. Integrated (cytotoxic and inflammatory) particle potency estimates across cell lines (A549, J774A.1 and THP-1).
Table 3. Top cellular function categories from IPA (highest Z-scores) of the cell lines exposed to 30 and 100 μg/cm2 doses of the particles.
Table 4. Pearson’s product moment correlations of the average particle potency estimates in vitro and the physico-chemical characteristics of the SiNPs.