Figures & data
Table 1. Summary of inhalation toxicity studies with CeO2NPs.
Figure 1. (A) CeO2NP aerosol particle size distribution. (B–D) Transmission electron microscope images of CeO2NP aerosol particles illustrating clear crystalline form (D).
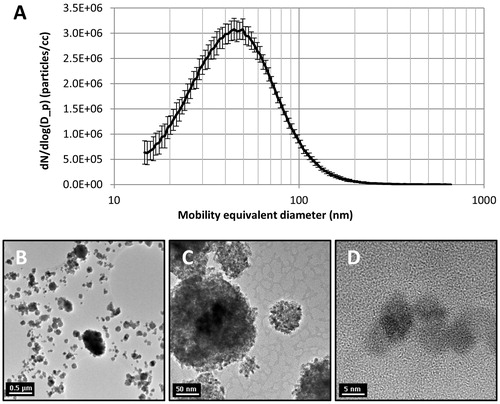
Table 2. Summary of aerosol characteristics and deposited dose estimates.
Figure 2. Comparison of changes in BALF parameters after 1 week (A) and 2 weeks (B) of exposure to CeO2NP aerosols. Changes are shown as fold differences compared to controls (H2O aerosols) using logarithmic scaling (MPH: macrophages; PMN: neutrophils; LYMPH: lymphocytes; LDH: lactate dehydrogenase; ALP: alkaline phosphatase).
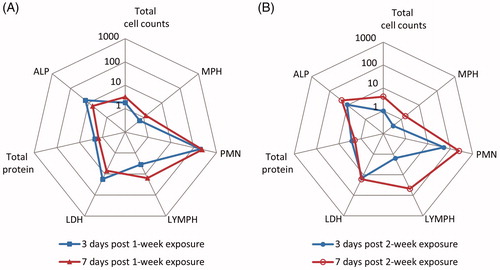
Figure 3. Cytokine levels in BALF from rats exposed to H2O or CeO2NP aerosols. (A) IL-1β, (B) TNF-α, (C) TFG-β1, (D) CXCL2/CINC-3, (E) CXCL1/CINC-1, and (F) CCL2/MCP-1. Data shown as mean ± SD (n = 5 rats for groups exposed to CeO2NP aerosols and n = 3 for control groups exposed to H2O aerosols). * p < 0.05, ** p < 0.01, *** p < 0.001.
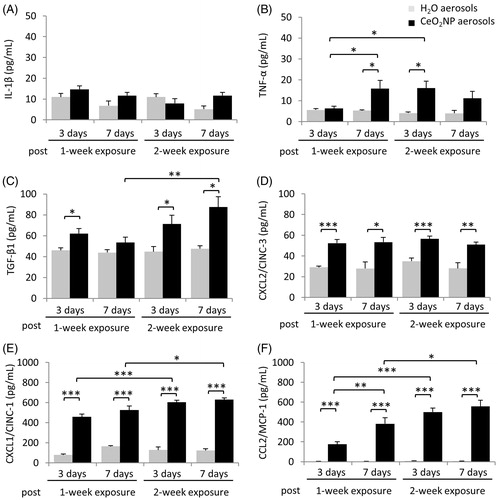
Figure 4. Representative hematoxylin and eosin stained lung sections (×200, inset ×400) from rats of negative controls (A and B) and CeO2NP aerosol exposure at 3 d (C and D) and 7 d (E and F) post-exposure (A, C, E, 1-week exposure; B, D, F, 2-week exposure). Symbols indicate some histopathological observations including infiltration of inflammatory cells (black arrows), deposition of amorphous eosinophilic materials (diamond arrows), alveolar wall injury (open arrows) and minor alveolar epithelial hyperplasia (areas inside black circles).
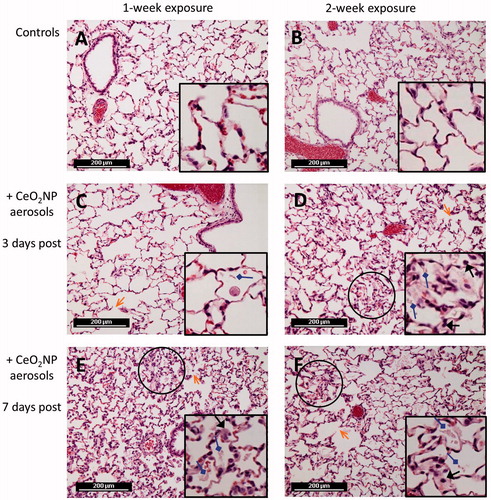
Figure 5. Principal component analysis (PCA) score plots of the gene expression (A) and lipidomics profiles (B) of lung tissue from rats exposed to H2O and CeO2NP aerosols for 1 week and 2 weeks at 3 d post-exposure.
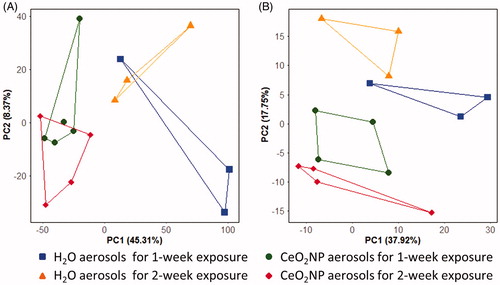
Figure 6. Representative laser ablation inductively coupled plasma mass spectrometry elemental maps (isotopes 13C and 140Ce) and light microscopy images (×12.5) of lung tissues of negative controls (images A–C) and CeO2NP aerosol exposed animals at 3 days (images D–F) and 7 d (images G–I) post-exposure. The light microscope images show the lung tissue section prior to undertaking laser ablation (which destroys the sample) and allow the overall shape and structures such as large airways and larger blood vessels to be seen for comparison purposes.
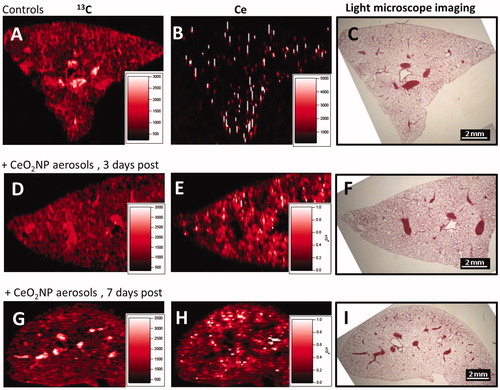
Figure 7. Transmission electron microscope images of lung tissue from rats exposed to H2O aerosols (A) and CeO2NP aerosols (B) for 2 weeks at 3 d post-exposure. The boxes with dotted lines denote the approximate locations of the corresponding magnified regions.
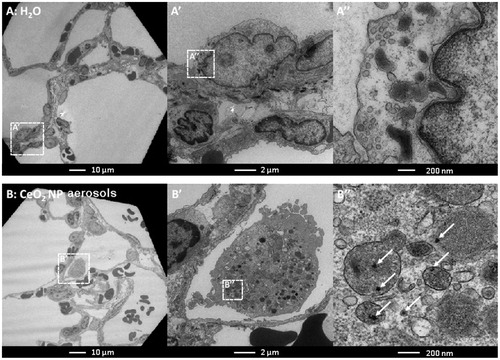
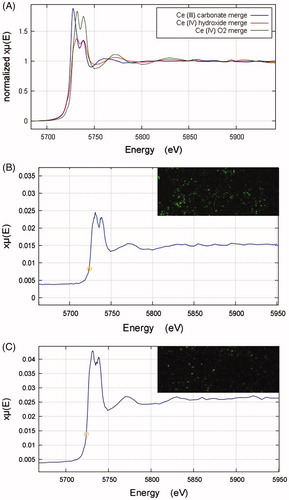
Figure 8. (A) XANES Ce LIII spectra for cerium standard samples of Ce2(CO3)3, Ce(OH)4, and CeO2. (B–C) XANES Ce LIII spectra derived from cerium-rich pixels of elemental µ-XRF maps of lung tissue sections from rats exposed to the CeO2NP aerosols for two weeks at 3 d (B, A combination of 4 pixels) and 7 d (C, A combination of 6 pixels) post-exposure. The top right-hand corner images in B and C are the associated elemental µ-XRF maps of cerium in lung tissue samples from animals post-exposure. Data obtained using the I18 beamline at the Diamond Light Source (pixel size 4 µm × 4 µm).