
Figures & data
Figure 1. Study phases. See Intervention section for details.
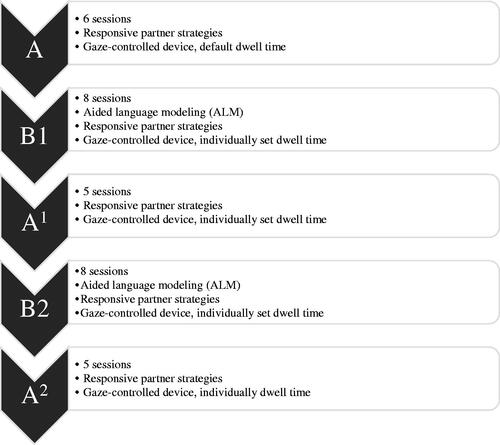
Table 1. Participant characteristics.
Figure 2. Synthesised words per minute expressed by Diana. Between session 16 and 17 there was a ten-day break. The dotted line = median score.
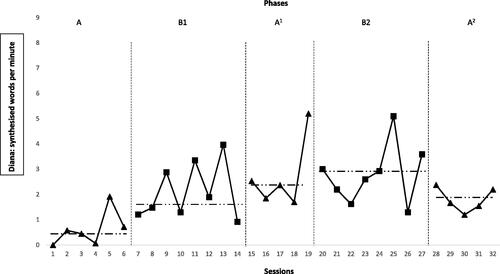
Figure 3. Unique synthesised words per minute expressed by Diana. Between session 16 and 17 there was a ten-day break. The dotted line = median score.
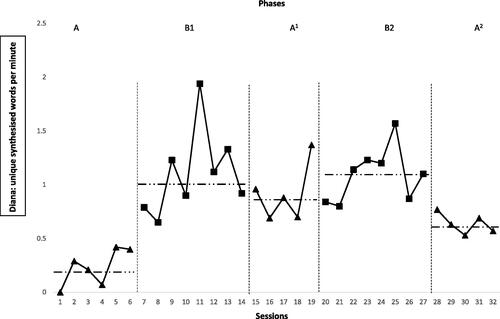
Figure 4. Rate of Diana’s focused gazes. Between session 16 and 17 there was a ten-day break. The dotted line = median score.
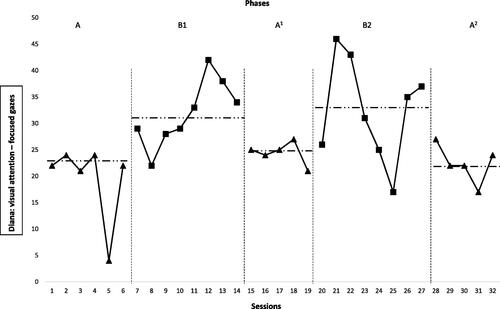
Figure 5. Synthesised words per minute expressed by Karen. Between session 16 and 17 there was a ten-day break. The dotted line = median score.
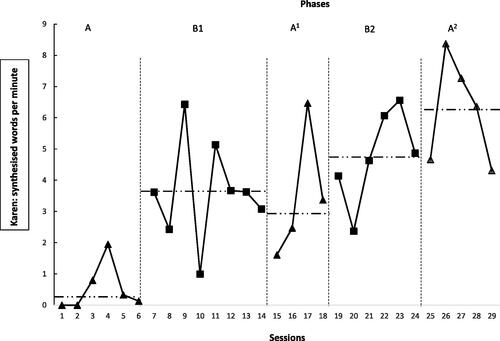
Figure 6. Unique synthesised words per minute expressed by Karen. Between session 16 and 17 there was a ten-day break. The dotted line = median score.
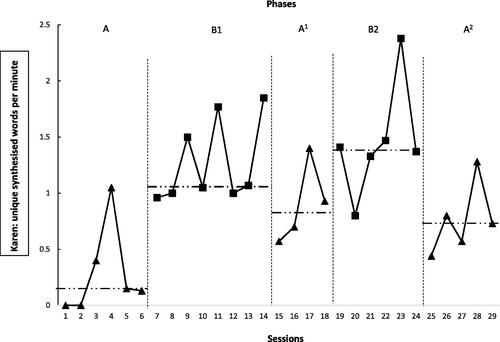
Figure 7. Rate of Karen’s focused gazes. Between session 16 and 17 there was a ten-day break. The dotted line = median score.
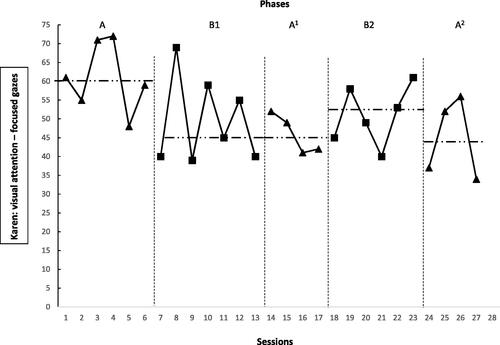
Figure 8. Synthesised words per minute expressed by Sarah. Between session 10 and 11 there was a ten-day break. The dotted line = median score.
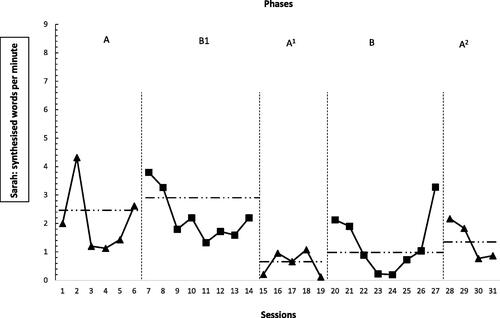
Figure 9. Unique synthesised words per minute expressed by Sarah. Between session 10 and 11 there was a ten-day break. The dotted line = median score.
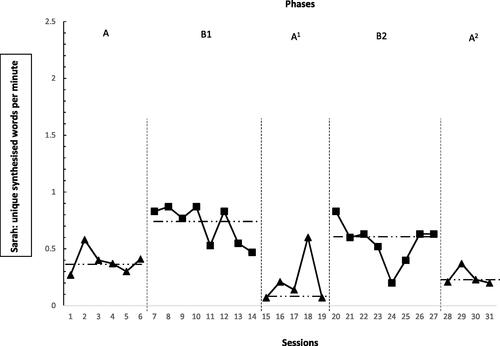
Figure 10. Rate of Sarah’s focused gazes. Between session 10 and 11 there was a ten-day break. The dotted line = median score.
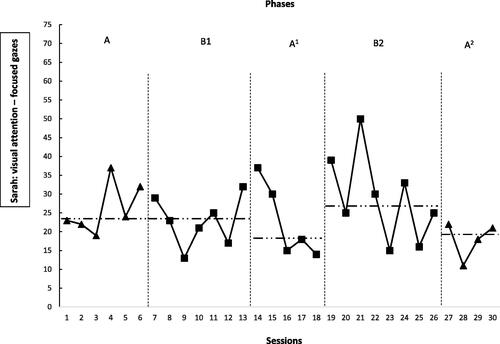
Table 2. Tau-U across all phases and Tau-U comparing phase A and B1.