
Figures & data
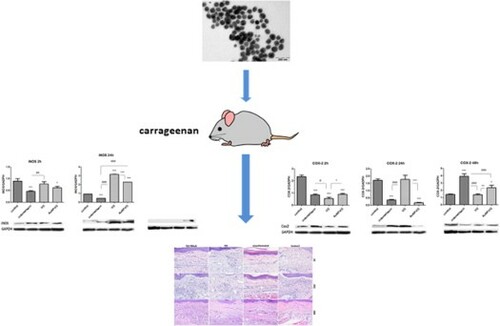
Figure 1. UV-Vis spectrum of the synthesized AuNP-VO (A). Characterization of the synthesized AuNP-VO: TEM image (B); histogram (C).
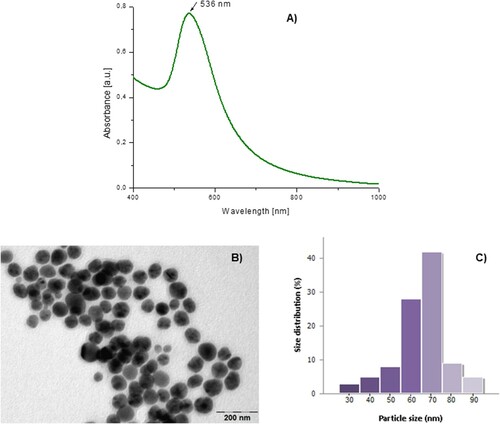
Figure 2. Characteristics of the obtained AuNP-VO: (A) zeta potential and (B) hydrodynamic diameter.
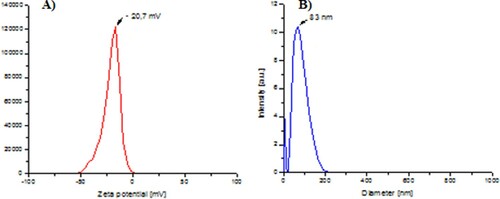
Figure 3. Paw volume at 2 h, 24 h and 48 h after carrageenan administration. At 2 h, paw edema was lower in the Indomethacin (p < 0.05) and VO (p < 0.01) groups compared to the control group. The statistical significance between the compared groups was evaluated with one-way ANOVA followed by the Tukey-test, *p < 0.05, **p < 0.01 vs control group.
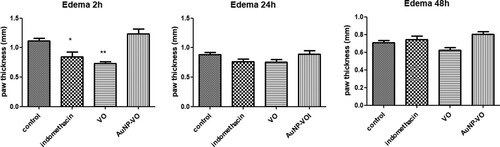
Figure 4. Malondialdehyde in serum (A) and plantar tissue (B) at 2 h, 24 h and 48 h after carrageenan administration. A. In serum, MDA diminished in all treated groups at all intervals, compared to the control group (p < 0.001). B. In the plantar homogenates, MDA level increased at 2 h and then decreased at 48 h in the Indomethacin and AuNP-VO groups, compared to the control group and VO group (p < 0.001). The statistical significance between the compared groups was evaluated with one-way ANOVA followed by the Tukey-test, ***p < 0.001 vs control group; ###p < 0.001 vs Indomethacin group; ^^^p < 0.001 between VO and AuNP-VO.
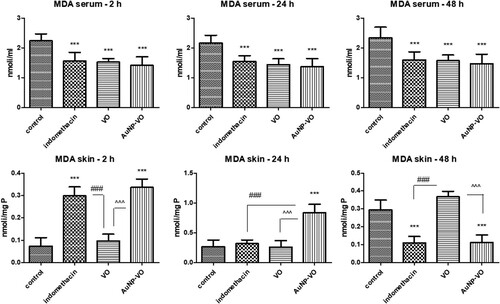
Figure 5. GSH/GSSG ratio in serum (A) and plantar tissue (B) at 2 h, 24 h and 48 h after carrageenan administration. A. In serum, the GSH/GSSG ratio increased at 2 h in all treated groups compared to the control group; the VO and AuNP-VO groups showed increases in the GSH/GSSG ratio at 24 h (p < 0.001) and at 48 h (p < 0.01). B. In the paw tissue, the GSH/GSSG ratio enhanced at 2 h in the AuNP-VO group compared to the control group (p < 0.001) and at 24 h compared to all groups (p < 0.001). At 48 h, the GSH/GSSG ratio decreased in AuNP-VO-treated group while in the Indomethacin group, the values were maintained increased compared to the other groups (p < 0.001). The statistical significance between the compared groups was evaluated with one-way ANOVA followed by the Tukey-test, *p < 0.05, **p < 0.01, ***p < 0.001 vs control group; #p < 0.05, ##p < 0.01, ###p < 0.001 vs Indomethacin group; ^^^p < 0.001 between VO and AuNP-VO.
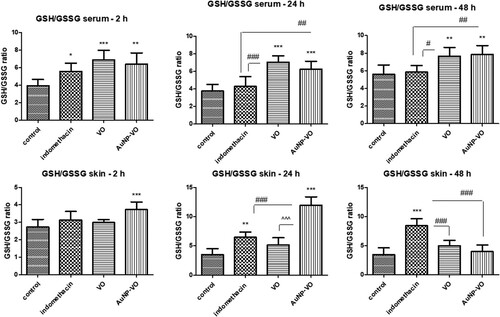
Figure 6. Catalase (A) and glutathione peroxidase (B) activities in plantar tissue at 2 h, 24 h and 48 h after carrageenan administration. CAT activity increased at 2 h in the VO-treated group (p < 0.01) and at 48 h in the group receiving AuNP-VO (p < 0.001), compared to controls. GPx activity was improved 48 h after AuNP-VO treatment (p < 0.001 vs. control group; p < 0.01 vs. Indomethacin group). The statistical significance between the compared groups was evaluated with one-way ANOVA followed by the Tukey-test, *p < 0.05, **p < 0.01, ***p < 0.001 vs control group; ##p < 0.01, ###p < 0.001 vs Indomethacin group; ^^^p < 0.001 between VO and AuNP-VO.
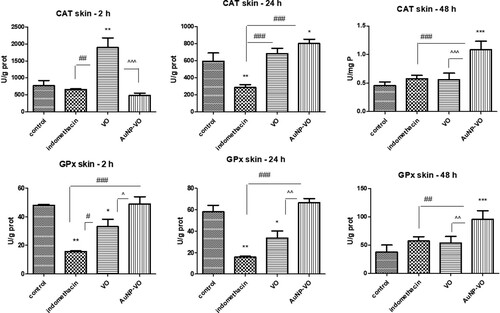
Figure 7. IL-1α (A), IL-1β (B), and IL-6 (C) levels in plantar tissue at 2, 24, and 48 h after carrageenan administration. The levels of IL-1α, IL-1β, and IL-6 were significantly reduced at 2 h in the groups treated with VO extract (p < 0.01) and AuNP-VO (p < 0.001) compared to the control group. Low IL-1β levels were maintained at 24 h (p < 0.01) in the AuNP-VO-treated group compared with indomethacin, while at 48 h, cytokine secretion decreased in the VO-treated group (p < 0.001) compared to the other groups. IL-1α levels increased at 24 h in the VO-and AuNP-VO-treated groups (p < 0.001), and increased at 48 h in the AuNP-VO-treated group (p < 0.001). The statistical significance between the compared groups was evaluated with one-way ANOVA followed by Tukey's test, **p < 0.01, ***p < 0.001 vs. control group; ###p < 0.001 vs. indomethacin group; ^^^p < 0.001 between VO and AuNP-VO.
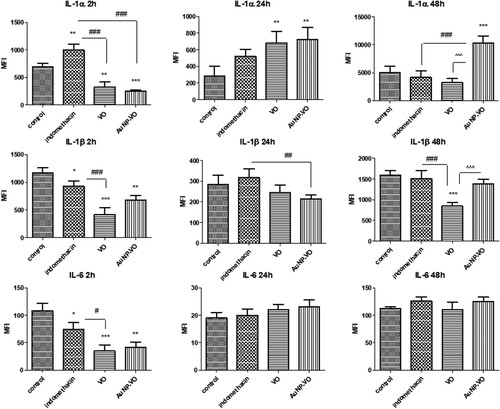
Figure 8. IL-10 (A) and TNFα (B) levels in the plantar tissue at 2 h, 24 h and 48 h after carrageenan administration. IL-10 (p < 0.01) and TNFα (p < 0.01 and p < 0.05) levels decreased at 2 h after carrageenan administration in animals treated with VO and AuNP-VO compared to Indomethacin group. The statistical significance between the compared groups was evaluated with one-way ANOVA followed by the Tukey-test, *p < 0.05, ***p < 0.001 vs control group; #p < 0.05, ##p < 0.01 vs Indomethacin group.
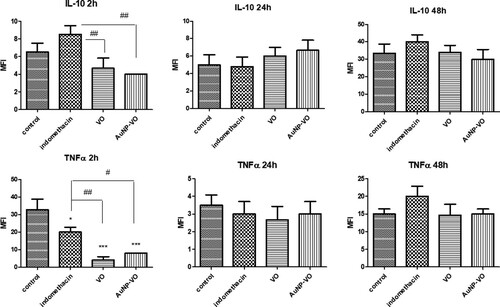
Figure 9. iNOS expressions in animal paw tissues at 2 h, 24 h and 48 h after carrageenan administration. Image analysis of WB bands was performed through densitometry (lower panel). Results normalized to GAPDH were shown in upper panel. At 2 h, iNOS expression decreased in the Indomethacin (p < 0.001) and AuNP-VO (p < 0.05) groups compared to the control group. At 24 h, iNOS increased in VO and AuNP-VO groups compared to control group or Indomethacin group (p < 0.001). At 48 h, Indomethacin, VO and AuNP-VO did not induce the iNOS expression The statistical significance between the compared groups was evaluated with one-way ANOVA followed by the Tukey-test, *p < 0.05, ***p < 0.001 vs control group; ##p < 0.01, ###p < 0.001 vs Indomethacin group; ^^^p < 0.001 between VO and AuNP-VO.
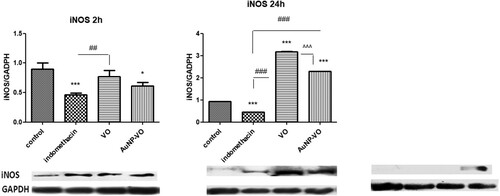
Figure 10. COX-2 expressions in the paw tissues at 2 h, 24 h and 48 h after carrageenan administration. Image analysis of WB bands was performed through densitometry (lower panel). Results normalized to GAPDH were shown in upper panel. At 2 h, COX-2 expression decreased in all treated groups compared to the control group. At 24 h the COX-2 values diminished in the Indomethacin and AuNP-VO groups compared to the control or VO group (p < 0.001). At 48 h, COX-2 increased in the Indomethacin group (p < 0.001) and in the AuNP-VO group (p < 0.05) compared to the control group or the VO group. The statistical significance between the compared groups was evaluated with one-way ANOVA followed by the Tukey-test, *p < 0.05, ***p < 0.001 vs control group; #p < 0.05, ###p < 0.001 vs Indomethacin group; ^p < 0.05, ^^p < 0.01, ^^^p < 0.001 between VO and AuNP-VO.
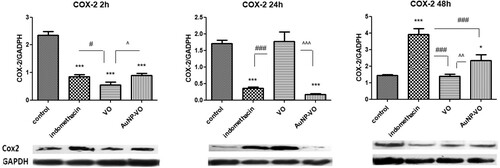
Figure 11. Paw changes histologically at 2 h, 24 h and 48 h after carrageenan administration. Prominent subcutaneous edema and mixed inflammatory infiltrates in the dermis and subcutis in the control, VO and AuNP-VO groups at 2 and 24 h, and minimal in the Indomethacin treated group. Edema and inflammation were reduced at 48 h across all groups but were significant compared to control group. HE stain x ob 40.
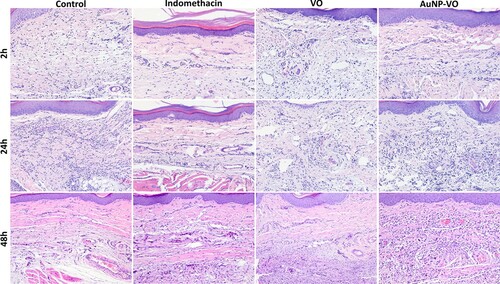
Table 1. Grading of paw lesions (inflammatory score average per group).