Figures & data
Table 1. Ingredients and chemical composition of experimental diets.
Table 2. Fatty acid composition, total phenolic compounds and antioxidant activity of grape seed oil.
Table 3. Effect of treatment on dry matter intake and growth performance.
Table 4. Effect of diets on plasma metabolites in lambs.
Table 5. Effect of diets on total fat (mg/100 g muscle) and fatty acid composition (g/100 g total fatty acids) of muscle from lambs.
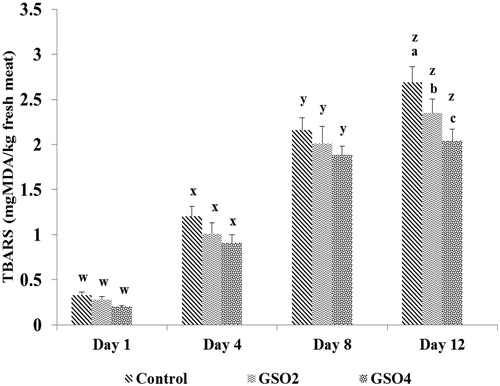
Figure 1. Effect of diet and storage time on the TBARS values of LL muscle. a,b,cWithin days of storage, different superscripts indicate differences between dietary treatments (p ≤ .05).w,x,y,zWithin each dietary treatment, different superscripts indicate difference between days of storage (p ≤ .05). Values are means, with SD represented by vertical bars.