
Figures & data
Figure 1. Key Residues at the Fc-FcRn Interface. Crystal structure (pdb: 4n0u) showing one Fc monomer and its glycosylation (dark gray ribbon), in complex with the α-domain (gray) and β2-m (light gray) hFcRn subunits. FcRn interacts with the Fc region at the CH2-CH3 interface with a pH-dependent affinity as a result of key surface histidine residues (black). The glycosylation of the CH2 domain is not required for FcRn binding. A saturation library of key residues was created at the Fc-FcRn interface and each position investigated in this study is shown as sticks and uniquely colored.
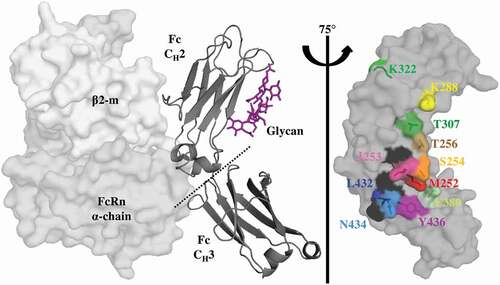
Table 1. In Vitro Characterization Parameters of the WT, Benchmark and Single Mutations. All data was obtained using the experimental techniques at the top of each column. FcRn affinity chromatography, DSF and FcγRIIIa binding were performed in triplicate (n = 3). FcRn binding kinetics to human and rat FcRn were obtained in quadruplicate and fit independently. *Mutations used in combination variants. Units: Biacore pH 6.0 hFcRn On Rate (x104 M−1 s−1), Off Rate (x10−1 s−1) and KD,app (x109 M); Biacore pH 6.0 rFcRn KD,app (x109 M); Biacore pH 7.4 hFcRn and rFcRn Steady State RU (RU), DSF Tm (°C); FcγRIIIa Binding (Steady State) .
Figure 2. Saturation Library Screening for Improved FcRn Off Rates. a. Normalization of the rFcRn binding kinetics at pH 6.0 of a subset of mutants (16) from the Octet screen. The mock and WT controls are represented by a black dotted and solid line, respectively. All mutants, represented by solid lines, fall into one of four categories: no FcRn binding (dark gray), faster (gray), WT-like (blue) or slower (red) rFcRn off rates compared to WT. The color scheme is identical for a, b and c. b. Scatterplot of the fold change in rFcRn off rate compared to WT. c. Fold change in the Octet FcRn binding off rates of the saturation library. WT positions are denoted by the solid black squares.
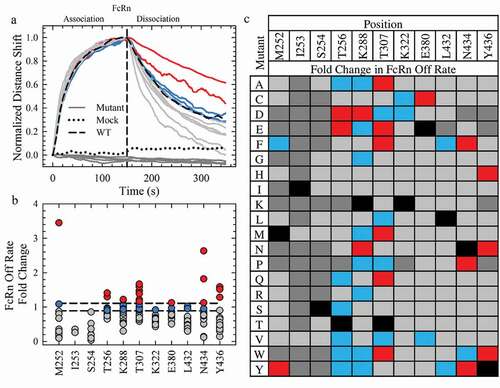
Figure 3. hFcRn Off Rates at pH 6.0. a. Normalized sensorgrams of the WT (dotted lines), LS (green solid lines), YTE (blue solid lines), and the lead single variants with improved hFcRn off rates compared to the WT (gray scale solid lines). b. Normalized sensorgrams of a representative variant of the single (dashed black lines), double (dark gray solid lines), triple (gray solid lines) and quadruple (black solid lines) combination variants. c. Binding affinity plots of the WT, LS (green circle), YTE (blue circle), single (white circles), double (gray circles), triple (dark gray circles) and quadruple (black circles) variants.
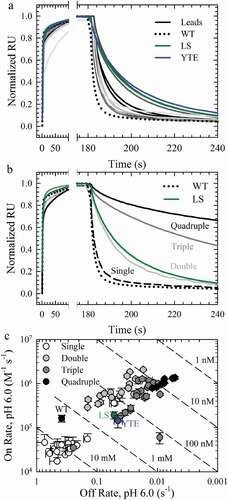
Table 2. In Vitro Characterization Parameters of the Seven Combination Variants with Favorable FcRn Binding Properties. The inserted mutations are bold and underlined in the WT (M252/T256/T307/N434: MTTN) sequence (i.e. MDQN refers to T256D and T307Q mutations). All data was obtained using the experimental techniques at the top of each column. FcRn affinity chromatography, DSF and FcγRIIIa binding were performed in triplicate (n = 3). FcRn binding kinetics to human and rat FcRn were obtained in quadruplicate and fit independently. For comparison, the steady state RU for the FcγRIIIa binding of the WT antibody is 142 ± 4 RU. Units: Biacore pH 6.0 hFcRn On Rate (x104 M−1 s−1), Off Rate (x10−1 s−1) and KD,app (x109 M); Biacore pH 6.0 rFcRn KD,app (x109 M); Biacore pH 7.4 hFcRn and rFcRn Steady State RU (RU), DSF Tm (°C); FcγRIIIa Binding (Steady State RU).
Figure 4. The Effect of Combination Mutations on the pH-Dependence of the FcRn Interaction. a. Representative FcRn affinity chromatography elution profiles of the single WT and LS (vertical dotted lines) compared to the single (dashed line), double (gray line), triple (dark gray line) and quadruple (black line) combination variants. b. Plot of the elution pH as a function of the off rate at pH 6.0; (R2 = 0.94). c. Sensorgrams of the FcRn binding at pH 7.4 using Biacore for the WT (black dotted line), LS (green line) and representative combination variants. The color scheme is the same as in a. c. Comparison of the residual FcRn binding at pH 7.4 with the FcRn binding affinity at pH 6.0. Lead combinations with improved FcRn binding properties occupy the lower left quadrant. The color scheme is the same as in b.
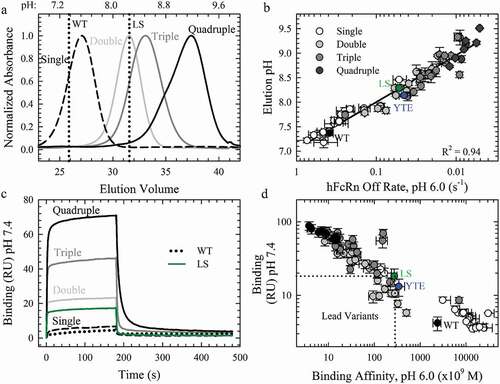
Figure 5. Key Antibody Attributes of the Lead Variants. a-c. FcRn affinity chromatography elution profiles, DSF fluorescence profiles and FcγRIIIa binding sensorgrams of the WT, YTE (horizontal dotted lines), YD (dashed black line), DQ (solid black line) and DW (dotted black lines) variants. d. Homogeneous bridging RF ELISA of these variants compared to WT, LS and YTE. **p < .001, *p < .01.
Figure 6. Antibody plasma half-life of the lead Fc variants. PK profiles of the plasma antibody concentration as a function of time of pooled samples from a single cohort of 6 hFcRn transgenic mouse (a) and n = 3 cynomolgus monkey (b) of the WT (black), LS (green), DQ (pink), DW (cyan) and YD (gray) antibodies.
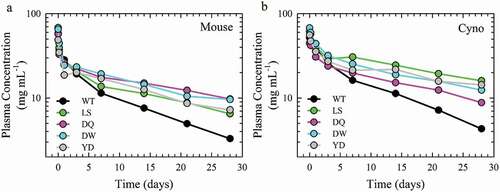
Table 3. Clearance Rates and Serum Half-Lives of the Lead Antibodies. The clearance rate and plasma-half-lives were determined for lead variants (DQ, DW, YD) and controls (WT, LS). *n = 2 due to anti-drug antibody formation, **n = 2 due to partial subcutaneous route of administration.