Figures & data
Table 1. Baseline characteristics of the study participants.
Table 2. Gastrointestinal transit and stool parameters before and after AXOS and Placebo intervention.
Figure 1. AXOS induces changes in gut microbiota. (a) Inverse Simpson index for alpha-diversity is reduced after AXOS intake. (b) Principal Response Curve summarizing the multivariate response of AXOS intervention versus Placebo over time (P = .05). ASVs with large deviations between AXOS and Placebo have high weights while taxa equally present in AXOS and Placebo have zero weight. ASVs with the highest weight plotted vertically on the right axis are the main drivers of the differences between interventions. ASVs that have a negative weight on the response curve follow the observed AXOS curve, whereas those with positive weights follow the opposite pattern. (c) Individual intervention responses of important ASVs. Individual changes depict the AXOS group (n = 21) and placebo (n = 17) before and after the intervention. ASV Amplicon sequence variant, AXOS Arabinoxylan-Oligosaccharides.
Figure 2. Short-chain fatty acid concentrations and gut permeability before and after AXOS (n = 24) and placebo intervention (n = 24). Data are given as means ± SEM. Data were analyzed using 2-way repeated measure ANOVA with time (pre/post) and intervention as covariates. There are no differences between fecal (a) acetate (b) propionate, (c) butyrate or fasting and postprandial plasma (d) acetate, (e) propionate, (f) butyrate between groups as a result of intervention (time*intervention, ns). Urinary sugar excretions and ratios were compared with Wilcoxon signed-rank test pre vs. post within groups. There were no differences in urinary excretion rates of (g) 0–5 h sucrose (gastro-duodenal permeability) (h) 0–5 h Lactulose:Rhamnose ratio (small intestinal permeability) (i) 5–24 h Sucralose:Erytrithol ratio (colonic permeability). AXOS Arabinoxylan-Oligosaccharides, PLA placebo.
Table 3. Circulating metabolites and insulin before and after AXOS and Placebo intervention.
Figure 3. Energy expenditure, substrate metabolism, GLP-1 and PYY before and after AXOS (n = 24) and Placebo (n = 24) intervention. Data are mean ± SEM and analyzed using 2-way repeated measure ANOVA with time (pre/post) and intervention as covariates. (a,b) Postprandial fat oxidation iAUC0-5h tended to increase after AXOS intervention (time*intervention P< .01, post-hoc AXOS P = .073, placebo P = .089). (c) Energy expenditure, (d) CHO oxidation, (e) CHO oxidation iAUC and (f) RQ were unchanged between groups after intervention. (g,h) Postprandial GLP-1 AUC0-90min decreased after AXOS intervention compared to placebo (time*intervention P = .043, post hoc AXOS P= .33, placebo P= .972). (i) PPY was not affected by the intervention. AXOS Arabinoxylan-Oligosaccharides, CHO carbohydrate, GLP-1 glucagon-like peptide-1, PYY peptide YY, iAUC incremental area under the curve, EE energy expenditure, RQ respiratory quotient, * P < .05.
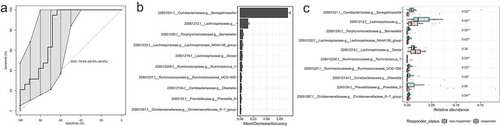
Figure 4. Identification of microbial ASVs as markers for responders with decreased WGTT after AXOS intervention by random forests models with 500-fold cross-validation. (a) The cross-validation error-based AUC was 79.9% with 10 000 bootstraps for a 95% confidence interval (65.8–94.0%). (b) The top 10 microbial ASVs that were important for the classification of responders with decreased WGTT. On the x-axis, MeanDecreaseAccuracy displays the decrease of model accuracy if the predictor ASV would be removed. (c)The abundance of the top 10 microbial groups in responders and non-responders after AXOS intervention. FDR adjusted P-values are given of a Wilcoxon signed-rank test between responders and non-responders. WGTT whole-gut transit time. AUC, area under the curve, AXOS, Arabinoxylan-Oligosaccharides, FDR false discovery rate.