
Figures & data
Table 1. Nutrient intake before and after 3 weeks of chitin-glucan supplementation in healthy volunteers.
Figure 1. Protocol design of the intervention.
One month before the start of the intervention, subjects were prescreened and followed a medical examination. Protocol starts at day 0, healthy subjects were asked to daily consume 4.5 g of CG during three weeks. The protocol ends at day 21. Test days took place at both day 0 (D0) and day 21 (D21) during that stool samples were collected. Patients were asked to fill out a food diary and questionnaires about gastrointestinal symptoms and quality of life (SF36: 36-item short form survey; VAS; 100-mm visual analog scales; BSFS: Bristol Stool Form Scale).
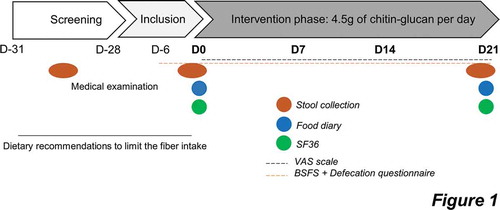
Figure 2. Gastrointestinal tolerance.
a: results of the Bristol stool scale (stool frequency and consistency) and the defecation questionnaire measuring urgency, facility and emptying. Data are expressed as mean±sem. NA: non applicable. Mixed-effects analysis were performed for detecting the treatment effect throughout the intervention. Mixed-effects analysis showed a significant effect of treatment on the evolution of level of emergency, and defecation facility, during the intervention (level of emergency, p < .05). b: gastrointestinal symptoms including discomfort, nausea, flatulence, cramp, burp, bloating, rumbling and reflux. Mixed-effects analysis were performed for detecting the treatment effect throughout the intervention. No significant difference was observed for any symptoms. c-d: Fecal concentrations of zonulin and calprotectin.
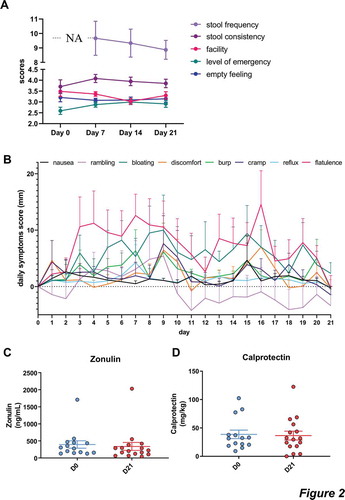
Table 2. Bacterial taxa and ASV significantly different after 3 weeks of CG intake.
Figure 3. CG did not change the overall composition of the gut microbiota.
a-c: Measures of alpha-diversity: Observed OTUs, Pielou’s evenness measure and Shannon. Data are expressed as mean±SEM. Wilcoxon matched-pairs test between D0 and D21. d-e: Principal coordinates analysis (PCoA) of the β-diversity indexes Bray-Curtis and Weighted UniFrac. p-values refer to Monte Carlo rank test performed on R software. f-g: Barplots of relative abundance of phylum and family levels accounting for more than 1% and 0.1% respectively. h: Correlation network analysis of genus significantly changed by CG. Spearman correlation, *p < .05. Orange lines indicate negative correlations, purple lines represent positive correlations.
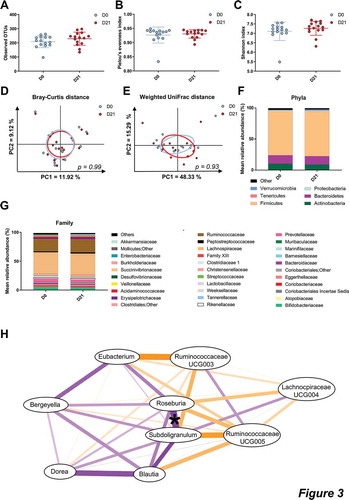
Figure 4. CG increased the fecal concentration of butyric, iso-valeric and caproic acids.
a: Fecal concentrations of SCFA. Data are expressed as mean ± sem. Wilcoxon matched-pairs test between D0 and D21. *p < .05 and **p < .01. B: Heatmap of Spearman’s correlations between the ASV significantly modified by CG treatment and the fecal concentrations of SCFA. The presence of a circle indicates that the correlation is significant, p < .05.
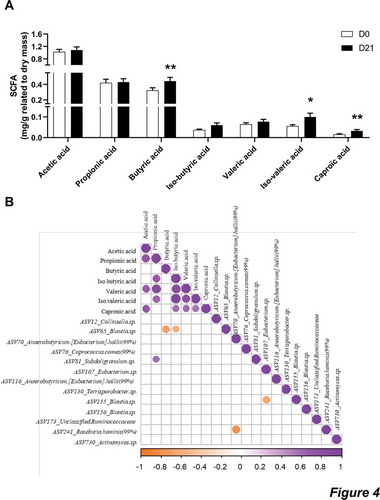
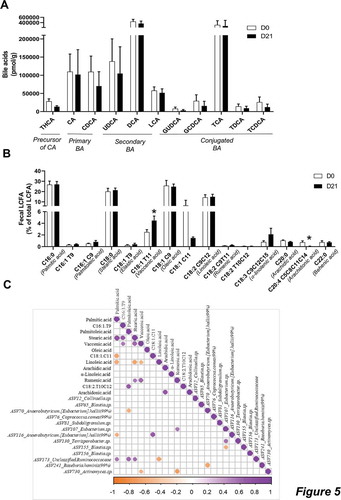
Figure 5. CG increased the fecal concentrations of vaccenic acid.
a: Data are normalized to the mass of dry matter and are expressed as mean ± sem of the ratio between the signal of the analyte and the signal of its internal standard. b: Percentage of LCFA/total LCFA detected in the feces of human volunteers. Data are expressed as mean ± sem. Wilcoxon matched-pairs test between D0 and D21. *p < .05. c: Heatmap of Spearman’s correlations between the ASV significantly modified by CG treatment and the fecal concentrations of LCFA. The presence of circle means that the correlation is significant, p < .05.
Supplemental material