
Figures & data
Figure 1. Time-resolved persistence and relative abundance of intragastrically administered L. plantarum-R strains in adult male rats. (a) L. plantarum-R strain panel legend (Figure 1(a)) with growth phenotypes. A plus (+) symbol indicates that capacity of a strain to utilise >DP3 inulin or DP3–4 GOS, while a minus (-) symbol indicates the lack of this capacity (see supplemental Figures S1–2).Citation14,Citation16 Strains with a (-) phenotype fail to utilise higher DP compounds but are still capable of utilising most mono- and di-saccharides present in either prebiotic substrate. (b) Persistence of administered L. plantarum-R strain cocktail in rats on Hca (circles, open), HcaGOS (black circles, closed) and HcaInu (grey circles, closed) diets after a single gavage with approximately 6 × 10⁹ CFU of L. plantarum-R on day 0. All CFU counts are log-transformed and expressed as mean ± SEM (n = 8 per diet group). #, the GOS-supplemented group is significantly different from the Hca control group (#: p < .05, ##: p < .01). *, the inulin-supplemented group is significantly different from the Hca control group control group (*: p < .05). (c) L. plantarum-R mixture was grown on ½ MRS-C supplemented with either 0.5% (w/v) GOS or inulin and passaged 1:500 after 24 hours of incubation for 8 days. Stacked area charts represent the relative abundance of L. plantarum strain-specific 339-IR-340 sequences amplified from isolated DNA from mixed bacterial cultures collected at different time points corresponding to estimated generations (see figure SF3 in the supplementary material). (d) Stacked area charts with relative abundance of L. plantarum strain-specific 339-IR-340 sequences amplified from isolated faecal DNA collected at different time points after L. plantarum-R gavage in rats on the different diets. Results are expressed as average of relative abundance, as fraction of the whole.
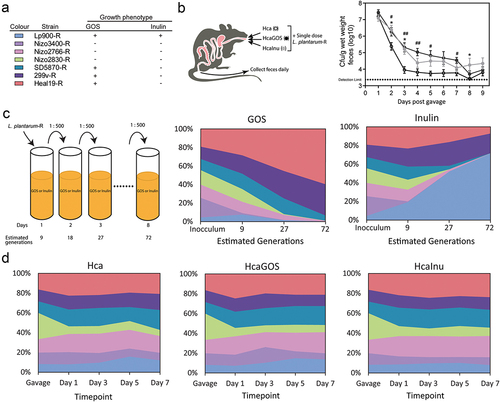
Figure 2. Exploring the relation between persistence, microbiota and fecal organic acid levels. RDA with the endogenous microbiota (genera) as response variables and the explanatory variable of diet: Hca (yellow squares), Lca (yellow circles), HcaGOS (blue squares), LcaGOS (blue circles) and HcaInu (red squares) with fecal organic lactic (LA), succinic (SA), acetic (AA), propionic (PA) and butyric (BA) acid levels, total acid levels and the persistence rate (i.e., inverse of linear decline rate) as supplementary variables. Blue arrows correspond to selected genera associated with the dietary regimes.
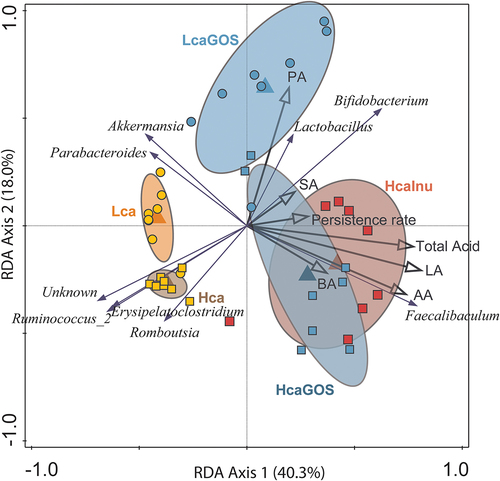
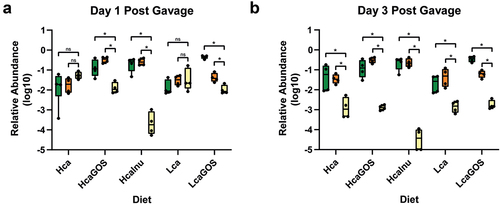
Figure 3. Relative abundance of L. plantarum-R compared to endogenous Bifidobacterium, Faecalibaculum abundance post-gavage. Relative abundance of Bifidobacterium (green), Faecalibaculum (orange), and the L. plantarum-R cocktail (yellow) after (a) one day post-gavage and (b) three days post-gavage. Asterisks (*) indicate significance after a two-sided Mann-Whitney t test. *: p < .05.
Supplemental Material
Download PDF (1.6 MB)Data availability statement
All data generated or analyzed during this study are included in this published article [and its supplementary information files].