Figures & data
Figure 1. PepO triggers macrophage autophagy. (a) PepO induced the elevation of autophagy marker ULK and beclin 1 and the turnover of LC3 I to LC3 II after 6 h of PepO treatment (10 μg/mL). (b) WT macrophage was differently treated and the LC3 was monitored by immunofluorescent microscopy. Recombinant PepO protein (10 μg/mL) induced obviously LC3 puncta aggregation comparing to PBS treated macrophage. (c) WT D39 infected macrophage showed significantly higher amounts of LC3 puncta than D39ΔpepO infected macrophage after 6 h of infection (MOI = 100). (d) and (e) The cells with numerous LC3 puncta of differently treated macrophage were counted (n = 100) in three independent experiments. Images were representative of three independent experiments. (d) and (e) were the statistical analyzation of (b) and (c), respectively. Data were shown as mean + SEM (n = 3) and are representative of three independent experiments. **p < 0.01; ***p < 0.001. Student’s t-test was employed for statistical analysis
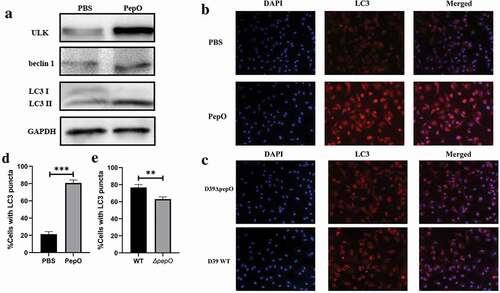
Figure 2. PepO-induced macrophage autophagy is related to the enhanced phagocytosis and bactericidal activity. (a) The co-localization of S. aureus and LC3 puncta was monitored by immunofluorescent microscopy. The longer PepO treated macrophage, the more co-localization of FITC-labeled S. aureus (green) and LC3 (red) was observed. (b) The phagocytosis index was calculated (n = 100) in three independent experiments. (c) S. aureus co-localized with LC3 puncta was counted (n = 100). (d) The macrophages were treated with Bafilomycin A1 (100 nM) for 1 h before PepO (10 μg/mL) treatment for 6 h, and the phagocytosis against S. aureus was assessed. (e) The bactericidal activity against S. aureus of Bafilomycin A1 and PepO-treated macrophages was assessed. (f) The relative NOS activity of different macrophages treated with PepO (10 μg/mL, 6 h) or with Bafilomycin A1 (100 nM, 1 h) before PepO treatment was assessed. Images were representative of three independent experiments. Data were shown as mean + SEM (n = 3) and are representative of three independent experiments. ns: no significance; *p < 0.05; **p < 0.01; ***p < 0.001. Student’s t-test was employed for statistical analysis
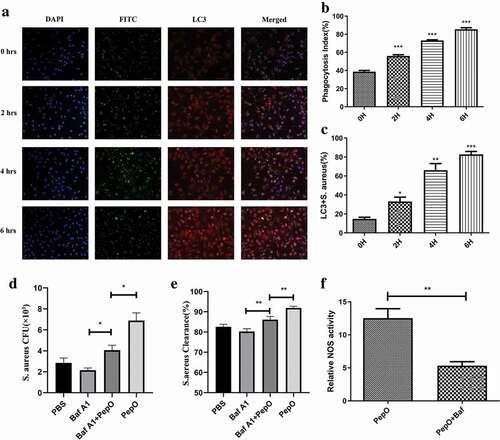
Figure 3. PepO-induced macrophage autophagy is dependent on TLR2 and TLR4. (a) WT, tlr2−/-, tlr4,−/- and tlr2/tlr4−/- macrophage were treated with PepO (10 μg/mL, 6 h) respectively, and the LC3 was monitored by immunofluorescent microscopy. (b) The cells with numerous LC3 puncta of PepO-treated different macrophages were counted (n = 100) in three independent experiments. (c) PepO inhibited the phosphorylation of mTOR and downstream signaling molecule p70S6 K, while inducing the turnover of LC3 I to LC3 II in WT macrophage. (d) PepO did not affect the mTOR signaling and autophagy in tlr2/tlr4−/- macrophage. Images were representative of three independent experiments. (e) PepO (10 μg/mL) induced a 2-phase alteration of mTOR phosphorylation, while AMPK phosphorylation is upregulated at the initial phase and decreased in longer time of treatment. The ULK-1 and LC3 II level is upregulated after PepO treatment. **p < 0.01; ***p < 0.001. Student’s t-test was employed for statistical analysis
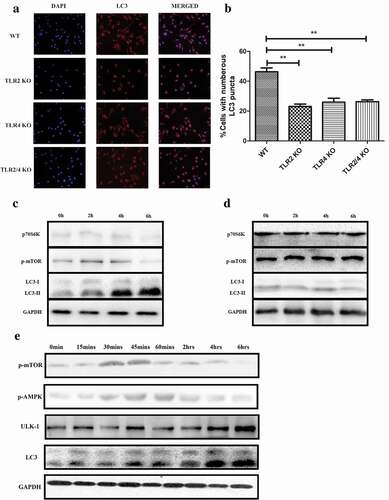
Figure 4. TLR2 and TLR4 both participate in PepO inducing macrophage function enhancement. (a) The PDMs were incubated with PepO, PepO 1–430, and PepO 431–630, respectively, the cell lysates were subjected to His-Tag IP and the interaction of different proteins with TLR2 and TLR4 were identified by TLR2 or TLR4 immunoblot. GAPDH was used as loading control. (b) PepO enhanced the phagocytosis of tlr2−/- macrophage, though higher dose was required. (c) PepO enhanced the phagocytosis of tlr4−/- macrophage. (d) tlr2/tlr4−/- macrophage did not respond to PepO stimulation. (e) PepO failed to reduce the bacterial load of S. pneumoniae in tlr2/tlr4−/- mice (n = 6 mice/group). (f) The macrophages were treated with Bafilomycin A1 before PepO treatment, and the phagocytosis against S. aureus was assessed. (g) The bactericidal activity against S. aureus of Bafilomycin A1 and PepO-treated macrophages was assessed. (h, i, and j) The relative NOS activity of different macrophages treated with PepO or with Bafilomycin A1 before PepO treatment was assessed. Data are shown as mean + SEM (n = 3) and are representative of three independent experiments. ns: not significant; **p < 0.01. Student’s t-test was employed for statistical analysis
Figure 5. PepO enhanced unspecific phagocytosis and bactericidal activity of macrophage. Murine primary macrophages were treated with PepO and then infected with S. pneumoniae (MOI = 100), S. aureus (MOI = 100), and P. aeruginosa, respectively (MOI = 50). (a, c and e) PepO enhanced macrophage phagocytosis against S. pneumoniae, S. aureus, and P. aeruginosa, respectively, in a dose-dependent manner. (b, d, and f) PepO enhanced macrophage bactericidal activity against the three species referred above. Data were shown as mean with SEM (n = 3) and are representative of three independent experiments. ns: not significant; *p < 0.05; **p < 0.01. Statistically significant differences were carried out by Student’s t-test
Figure 6. PepO promotes pulmonary bacterial clearance in C57/BL6 mice. Mice were treated with 10 μg rPepO 6 h before bacterial infection. PBS and LytR were employed as control. (a) PepO significantly reduced the bacteria load of S. pneumoniae D39-infected mice. (b) PepO significantly reduced the bacteria load of an MDR P. aeruginosa-infected mice. (c) In macrophage depleted mice, PepO failed in reducing the bacteria load of D39 infected mice. Data were expressed as mean with SEM (n = 6 mice/group). ns: not significant; *p < 0.05; **p < 0.01; ***p < 0.001. Statistically significant differences were carried out by Student’s t-test