Figures & data
Figure 1. NK cell maturation is impaired in Tyk2−/− but partially restored in Tyk2K923E mice. (A) Frequency of all NK cells in bone marrow (Lin−CD122+) was assessed by flow cytometry. (B) Total NK cells were divided into subpopulations of three developmental stages: NK precursor (NKP), immature (iNK) and mature (mNK) NK cells. Percentages of NKPs (DX5−NK1.1−), iNKs (DX5−NK1.1+) and mNKs (DX5+NK1.1+) among the Lin−CD122+ population in bone marrow obtained from WT, Tyk2K923E and Tyk2−/− mice are shown. (C) Percentages of NK cells in the spleen were assessed by flow cytometry. (D) Splenic CD3ε−NK1.1+ cells were analyzed for the expression of maturation markers CD27 and CD11b. Percentage of NK cells in each of the four maturation stages: CD27−CD11b−, CD27+CD11b−, CD27+CD11b+ and CD27−CD11b+ is shown. (E, F) The abundance of KLRG1+ cells among CD3ε−NK1.1+ population and the level of KLRG1 expression (MFI) were assessed in the spleen of WT, Tyk2K923E and Tyk2−/− mice. (G) Percentage of NK cells (CD3ε−TCRβ−NKp46+) among liver lymphocytes was assessed by flow cytometry. (H) Liver NK cells were divided into two subpopulations: liver resident NK cells (CD49a+) and conventional NK cells (CD49b+) and the total number of each population is presented. (A, C, E, F, G) Boxplots with whiskers from minimum to maximum show data derived from two (A, E, F, n = 6–8 per genotype) or three (C, G, n = 10 per genotype) independent experiments. (B, D, H) Mean ± SEM of two independent experiments is presented (n = 6–7 per genotype). (A–H) * P < 0.05, **P < 0.01, *** P < 0.001.
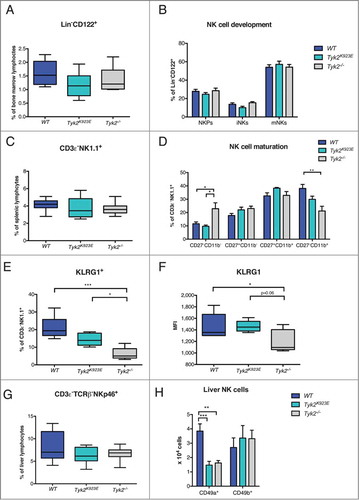
Figure 2. NK cells expressing NKG2D and DNAM-1 are more abundant in Tyk2K923E than in Tyk2−/− mice. Frequency of splenic NK cells expressing activating or inhibitory receptors and level of surface expression of these receptors (MFI) was assessed by flow cytometry. Boxplots with whiskers from minimum to maximum show percentage (left panel) and MFI (right panel) of CD3ε−NK1.1+ cells positive for receptors (A) Ly49H, (B) Ly49G2, (C) NKG2D and (D) DNAM-1. Data are derived from three (A, B, n = 10 per genotype) or two (C, D, n = 6−8 per genotype) independent experiments. (A-D) * P < 0.05, ** P < 0.01, *** P < 0.001.
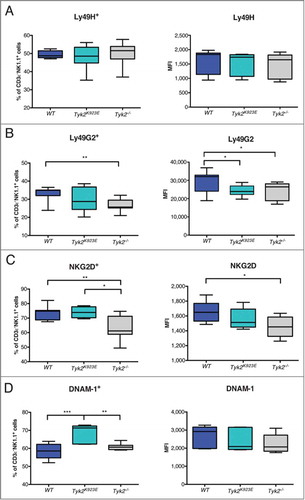
Figure 3. miRNAs but not cytolytic proteins show differential expression patterns between WT, Tyk2K923E and Tyk2−/− NK cells. DX5+ cells were MACS-purified from spleens of WT, Tyk2K923E and Tyk2−/− mice and (A) directly used for RNA analysis or (B, C) expanded for 7 d with IL-2. (A, B) Expression levels of miR-155, miR-223, miR-27a* and miR-30e were analyzed using RT-qPCR. Mean ± SEM of two (A, n = 6−8 per genotype) or three (B, n = 9−11 per genotype) independent experiments is presented (*P < 0.05, ** P < 0.01, *** P < 0.001). (C) Protein levels of GzmB and Prf1 were analyzed by Western blot and quantified using ImageJ software. One representative blot and the mean values ± SEM of the quantifications (normalized to WT cells) derived from two independent experiments are shown (n = 4 per genotype).
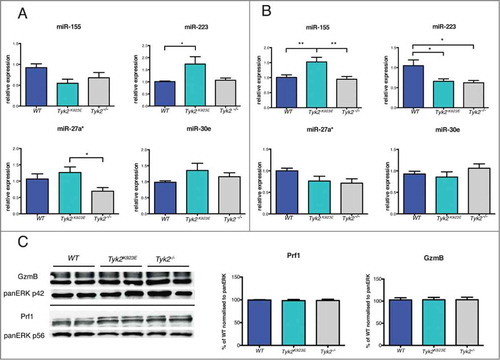
Figure 4. IFNγ production by NK cells is dependent on TYK2 kinase activity. (A) DX5+ cells were MACS-purified from spleens of WT, Tyk2K923E and Tyk2−/− mice, expanded for 7 d with IL-2, stimulated with IL-12 for indicated time points or left untreated (w/o) and further analyzed for activation of STATs and JAK2 and for IFNγ production. Levels of pSTAT3, pSTAT4 and pJAK2 were assessed by Western blot and a representative blot out of two independent experiments is shown (left panel). The production of IFNγ by NK cells was assessed by ELISA (right panel) and mean ± SEM is presented from three independent experiments (n = 3 per genotype per treatment). (B) WT, Tyk2K923E and Tyk2−/− splenocytes were stimulated with anti-NK1.1 antibody for 5 h. Intracellular IFNγ levels were assessed by flow cytometry and the percentage of IFNγ+ cells within the CD3ε−DX5+ population (left panel) or level of IFNγ expression (MFI, right panel) is shown as boxplots with whiskers from minimum to maximum from three independent experiments (n = 6−8 per genotype). (C) WT, Tyk2K923E and Tyk2−/− splenocytes were stimulated with anti-NK1.1 antibody for 8 h. Intracellular CCL3 levels were assessed by flow cytometry and the percentage of CCL3+ cells within the CD3ε−DX5+ population (left panel) or level of CCL3 expression (MFI, right panel) is shown as boxplots with whiskers from minimum to maximum from two independent experiments (n = 4 per genotype). (A, B, C) *P < 0.05, **P < 0.01, ***P < 0.001.
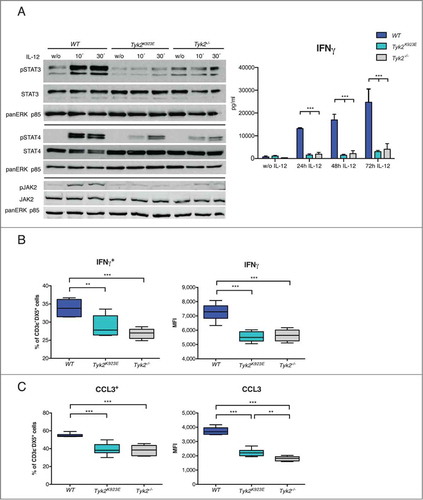
Figure 5. Kinase-inactive TYK2 partially restores cytotoxic capacity of NK cells. (A) DX5+ cells were MACS-purified from spleens of WT, Tyk2K923E and Tyk2−/− mice expanded for 5–7 d with IL-2 and mixed at a 1:1 ratio with YAC-1 cells stained with eFluor®670. The graph shows the percentage of duplets (NK1.1+eFluor®670+) among the CD3ε− population after 0 or 10 min incubation at 37°C. (B) Splenocytes of WT, Tyk2K923E and Tyk2−/− mice were stimulated with anti-NK1.1 antibody for 4 h in the presence of CD107a antibody. The graph shows the induction of CD107a (MFI anti-NK1.1 stimulated minus MFI unstimulated) in the CD3ε−DX5+population. (A, B) Mean ± SEM of three (A, n = 6 per genotype) or four (B, n = 12 per genotype) independent experiments is presented. (C, D, E) DX5+ cells MACS-purified from spleens of WT, Tyk2K923E and Tyk2−/− mice, expanded for 7 d with IL-2 were mixed at indicated effector : target ratios (10:1, 5:1, 1:1) with CFSE stained target cells for 4 h. The specific lysis of target cells was assessed by flow cytometry. One representative out of at least two independent experiments is shown for (C) RMA-S and (E) YAC-1 target cells; (D) RMA-Rae1 were used as targets in one experiment. (F) WT and β2m−/− splenocytes were stained with CFSElow and CFSEhigh concentration, respectively, mixed 1:1 and injected i.v. into recipient WT, Tyk2K923E and Tyk2−/− mice. After 16 h splenocytes from recipients were analyzed by flow cytometry. Percentage of rejected β2m−/− cells is shown as mean ± SEM of four independent experiments (n = 10−12 per genotype). (A–F) * P < 0.05, ** P < 0.01, *** P < 0.001
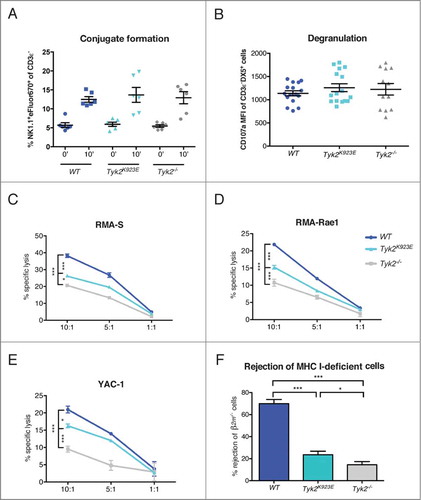
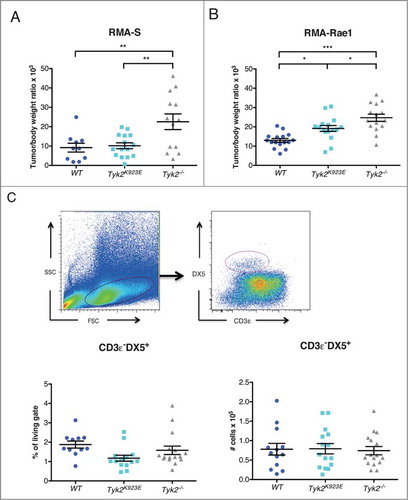
Figure 6. Mice expressing kinase-inactive TYK2 show improved tumor growth control compared to TYK2-deficient mice. (A) 10Citation6 RMA-S or (B) 10Citation6 RMA-Rae1 cells were injected s.c. into the right and left flank of WT, Tyk2K923E and Tyk2−/− mice and tumor growth was monitored for 15 or 11 d, respectively. Relative tumor weight is depicted for individual tumors; horizontal lines represent mean values ± SEM from two independent experiments (n = 10−16 per genotype). (C) Tumor infiltrating NK cells were analyzed in RMA-Rae1 tumors by flow cytometry using presented gating strategy (upper panel). The graphs show percentage (left panel) and total amount (right panel) of NK cells. Mean ± SEM of two independent experiments is presented (n = 14−16 per genotype). (A–C) * P < 0.05, ** P < 0.01, *** P < 0.001.