2,442
Views
30
CrossRef citations to date
0
Altmetric
Original Research

Programmed Death Ligand 1 (PD-L1)-targeted TRAIL combines PD-L1-mediated checkpoint inhibition with TRAIL-mediated apoptosis induction

, , , , , , & show all
Article: e1202390 | Received 21 Mar 2016, Accepted 12 Jun 2016, Published online: 06 Jul 2016

Figures & data

Figure 1. anti-PD-L1:TRAIL induces PD-L1-restricted TRAIL-mediated apoptosis in cancer cells. (A) Binding of anti-PD-L1:TRAIL to DLD-1.PD-L1 cells in the presence or absence of excess PD-L1 blocking antibody (10 µg/mL) was analyzed by flow cytometry. (B) DLD-1.PD-L1 or DLD-1 cells were incubated with an increasing dose of anti-PD-L1:TRAIL and binding was assessed by flow cytometry. (C) DLD-1.PD-L1 or DLD-1 cells were treated with an increasing dose of anti-PD-L1:TRAIL for 18 h, after which apoptosis was measured by flow cytometry using Annexin-V staining. (D) DLD-1.PD-L1 or DLD-1 cells were treated with anti-PD-L1:TRAIL (250 ng/mL), anti-EpCAM:TRAIL (250 ng/mL) or PD-L1 antibody (1 µg/mL). Apoptosis was assessed by Annexin-V staining after 18 h. (E) DLD-1.PD-L1 or DLD-1 cells were treated with anti-PD-L1:TRAIL (250 ng/mL) in the presence or absence of PD-L1 blocking antibody (10 µg/mL), TRAIL-neutralizing mAb (1 µg/mL), or total caspase inhibitor z-VAD-fmk (10 µM). DLD-1.PD-L1 or DLD-1 cells were also treated with anti-MCSP:TRAIL(250 ng/mL). Apoptosis was assessed by Annexin-V staining after 18 h. (F) PD-L1-expressing cell lines were co-treated with cycloheximine (CHX, 1 µg/mL) and anti-PD-L1:TRAIL (1 µg/mL). Apoptosis was determined by Annexin-V staining after 18 h. (G) Representative light microscopy images of spheroid size of DLD-1.PD-L1 cells or DLD-1 cells in medium control versus anti-PD-L1:TRAIL-treated conditions after 72 h. (H) Spheroid formation of DLD-1.PD-L1 or DLD-1 cells was assessed in the presence or absence of 100 ng/mL anti-PD-L1:TRAIL, anti-MCSP:TRAIL, or anti-EpCAM:TRAIL. Number of spheroid colonies was determined after 72 h by counting three fields-of-view per condition in triplicates. (I) Established spheroids of DLD-1.PD-L1 cells or DLD-1 cells were treated with 500 ng/mL anti-PD-L1:TRAIL, anti-MCSP:TRAIL or anti-EpCAM:TRAIL. Cell viability was determined by MTS after 72 h. All graphs represent mean±SD. Statistical analysis was performed using two-way ANOVA (*p < 0.05, **p < 0.01, ***p < 0.001, n.s. not significant).
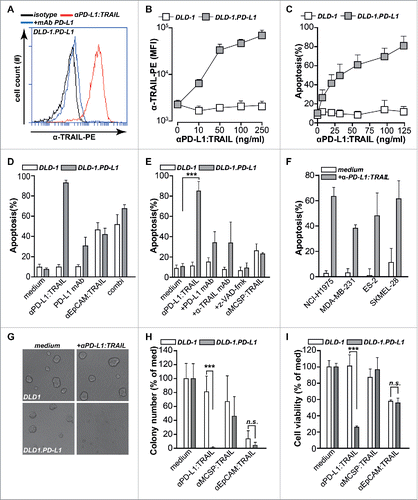
Figure 1. anti-PD-L1:TRAIL induces PD-L1-restricted TRAIL-mediated apoptosis in cancer cells. (A) Binding of anti-PD-L1:TRAIL to DLD-1.PD-L1 cells in the presence or absence of excess PD-L1 blocking antibody (10 µg/mL) was analyzed by flow cytometry. (B) DLD-1.PD-L1 or DLD-1 cells were incubated with an increasing dose of anti-PD-L1:TRAIL and binding was assessed by flow cytometry. (C) DLD-1.PD-L1 or DLD-1 cells were treated with an increasing dose of anti-PD-L1:TRAIL for 18 h, after which apoptosis was measured by flow cytometry using Annexin-V staining. (D) DLD-1.PD-L1 or DLD-1 cells were treated with anti-PD-L1:TRAIL (250 ng/mL), anti-EpCAM:TRAIL (250 ng/mL) or PD-L1 antibody (1 µg/mL). Apoptosis was assessed by Annexin-V staining after 18 h. (E) DLD-1.PD-L1 or DLD-1 cells were treated with anti-PD-L1:TRAIL (250 ng/mL) in the presence or absence of PD-L1 blocking antibody (10 µg/mL), TRAIL-neutralizing mAb (1 µg/mL), or total caspase inhibitor z-VAD-fmk (10 µM). DLD-1.PD-L1 or DLD-1 cells were also treated with anti-MCSP:TRAIL(250 ng/mL). Apoptosis was assessed by Annexin-V staining after 18 h. (F) PD-L1-expressing cell lines were co-treated with cycloheximine (CHX, 1 µg/mL) and anti-PD-L1:TRAIL (1 µg/mL). Apoptosis was determined by Annexin-V staining after 18 h. (G) Representative light microscopy images of spheroid size of DLD-1.PD-L1 cells or DLD-1 cells in medium control versus anti-PD-L1:TRAIL-treated conditions after 72 h. (H) Spheroid formation of DLD-1.PD-L1 or DLD-1 cells was assessed in the presence or absence of 100 ng/mL anti-PD-L1:TRAIL, anti-MCSP:TRAIL, or anti-EpCAM:TRAIL. Number of spheroid colonies was determined after 72 h by counting three fields-of-view per condition in triplicates. (I) Established spheroids of DLD-1.PD-L1 cells or DLD-1 cells were treated with 500 ng/mL anti-PD-L1:TRAIL, anti-MCSP:TRAIL or anti-EpCAM:TRAIL. Cell viability was determined by MTS after 72 h. All graphs represent mean±SD. Statistical analysis was performed using two-way ANOVA (*p < 0.05, **p < 0.01, ***p < 0.001, n.s. not significant).

Figure 2. anti-PD-L1:TRAIL blocks the PD-1/PD-L1 interaction and enhances T cell activation. (A) Binding of PD-1:Fc (4 µg/mL) to DLD-1.PD-L1 cells in the presence of an increasing dose of anti-PD:L1:TRAIL or anti-EpCAM-TRAIL was analyzed by flow cytometry. (B) Representative histograms of CFSE-labeled PBMCs co-treated with agonistic CD3 mAb (0.5 µg/mL) and 500 ng/mL anti-PD-L1:TRAIL or anti-EpCAM:TRAIL. After 72 h, cell proliferation was analyzed by flow cytometry. (C) PBMCs were treated with 500 ng/mL anti-PD-L1:TRAIL or anti-EpCAM:TRAIL in the presence of agonistic CD3 mAb (0.5 μg/mL). After 72 h, cell number was quantified using an automated cell counter. (D) PBMCs were co-treated with agonistic CD3 mAb (0.5 μg/mL) and an increasing dose of anti-PD-L1:TRAIL or anti-EpCAM:TRAIL. After 72 h, IFNγ levels in culture supernatant were determined by ELISA. (E) PBMCs were co-treated with agonistic CD3 mAb (0.5 μg/mL) and 500 ng/mL anti-PDL1:TRAIL, anti-EPCAM:TRAIL or mAb PD-L1 for 72 h. IFNγ levels in culture supernatant were determined by ELISA. (F) PBMCs from CMV-positive or CMV-negative donors and were treated with 500 ng/mL anti-PD-L1:TRAIL in the presence of CMV protein pp65 for 96 h. IFNγ levels in culture supernatant were determined by ELISA. All graphs represent mean±SD. Statistical analysis was performed using unpaired two-sided Student t test (C), two-way ANOVA (D) or Wilcoxon matched pairs test (F) (*p < 0.05, **p < 0.01, ***p < 0.001, n.s. not significant).
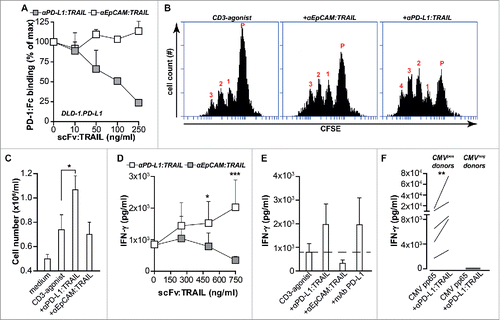
Figure 2. anti-PD-L1:TRAIL blocks the PD-1/PD-L1 interaction and enhances T cell activation. (A) Binding of PD-1:Fc (4 µg/mL) to DLD-1.PD-L1 cells in the presence of an increasing dose of anti-PD:L1:TRAIL or anti-EpCAM-TRAIL was analyzed by flow cytometry. (B) Representative histograms of CFSE-labeled PBMCs co-treated with agonistic CD3 mAb (0.5 µg/mL) and 500 ng/mL anti-PD-L1:TRAIL or anti-EpCAM:TRAIL. After 72 h, cell proliferation was analyzed by flow cytometry. (C) PBMCs were treated with 500 ng/mL anti-PD-L1:TRAIL or anti-EpCAM:TRAIL in the presence of agonistic CD3 mAb (0.5 μg/mL). After 72 h, cell number was quantified using an automated cell counter. (D) PBMCs were co-treated with agonistic CD3 mAb (0.5 μg/mL) and an increasing dose of anti-PD-L1:TRAIL or anti-EpCAM:TRAIL. After 72 h, IFNγ levels in culture supernatant were determined by ELISA. (E) PBMCs were co-treated with agonistic CD3 mAb (0.5 μg/mL) and 500 ng/mL anti-PDL1:TRAIL, anti-EPCAM:TRAIL or mAb PD-L1 for 72 h. IFNγ levels in culture supernatant were determined by ELISA. (F) PBMCs from CMV-positive or CMV-negative donors and were treated with 500 ng/mL anti-PD-L1:TRAIL in the presence of CMV protein pp65 for 96 h. IFNγ levels in culture supernatant were determined by ELISA. All graphs represent mean±SD. Statistical analysis was performed using unpaired two-sided Student t test (C), two-way ANOVA (D) or Wilcoxon matched pairs test (F) (*p < 0.05, **p < 0.01, ***p < 0.001, n.s. not significant).

Figure 3. PD-L1:TRAIL enhances anticancer T cell activity. (A) DiD-labeled A2058 cells were co-cultured with PBMCs at E:T ratio 5:1. Where indicated, cells were co-treated with 500 ng/mL anti-PD-L1:TRAIL or anti-EpCAM:TRAIL, in the presence or absence of agonistic CD3 mAb (0.5 μg/mL). After 48 h, apoptosis in DiD-positive cells was determined by flow cytometry using DiOC6 staining (B) Autologous primary patient-derived melanoma cells and TILs were co-cultured at E:T ratio 2:1 and treated with 1 μg/mL anti-PD-L1:TRAIL, anti-EpCAM:TRAIL or 4 μg/mL mAb PD-L1 for 48 h. IFNγ levels in culture supernatant were determined by ELISA. (C) Primary patient-derived melanoma and appendix carcinoma cells were co-cultured with autologous TILs at E:T ratio 2:1 and treated with 1 μg/mL anti-PD-L1:TRAIL for 48 h, after which apoptosis was assessed by Annexin-V staining. (D) DiD-labeled A2058 cells were co-cultured with PBMCs at E:T ratio 5:1 in the presence of agonistic CD3 mAb (0.5 μg/mL). Cells were co-treated with 500 ng/mL anti-PD-L1:TRAIL or anti-EpCAM:TRAIL, where indicated cells were co-treated with TRAIL-neutralizing antibody (1 ug/mL). After 48 h, apoptosis in DiD-positive cells was determined by flow cytometry using DiOC6 staining. (E) In mixed cultures of PBMCs and A2058 as described in D, the PBMC population was stained with fluorescent CD4 and CD8 antibodies whereupon the number of CD4+ and CD8+ T cells within the PBMC gate was analyzed by flow cytometry. (F) DiD-labeled A2058 cells were co-cultured with isolated CD3+ T-cells at E:T ratio 5:1 in the presence of CD3/CD28 beads at a bead-to-cell ratio of 1:10. Cells were co-treated with 500 ng/mL anti-PD-L1:TRAIL or anti-EpCAM:TRAIL and after 48 h, apoptosis in DiD-positive cells was determined by flow cytometry using DiOC6 staining. (G) IFNγ levels in culture supernatant of F were determined by ELISA. (H) DLD-1 cells were pre-seeded 24 h before PBMCs were added at indicated E:T ratio's in the presence of anti-EpCAM:anti-CD3 (50 ng/mL) with or without 500 ng/mL anti-PD-L1:TRAIL or anti-MCSP-TRAIL. Cell viability was determined by MTS after 24 h. (I) IFNγ levels in culture supernatant of H were determined by ELISA. All graphs represent mean ± SD. Statistical analysis was performed using two-way ANOVA (A), one-way ANOVA (D) or unpaired two-sided Student t test (B, F) (*p < 0.05, **p < 0.01, ***p < 0.001, n.s. not significant).
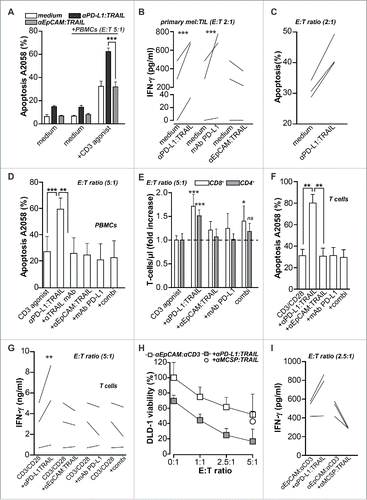
Figure 3. PD-L1:TRAIL enhances anticancer T cell activity. (A) DiD-labeled A2058 cells were co-cultured with PBMCs at E:T ratio 5:1. Where indicated, cells were co-treated with 500 ng/mL anti-PD-L1:TRAIL or anti-EpCAM:TRAIL, in the presence or absence of agonistic CD3 mAb (0.5 μg/mL). After 48 h, apoptosis in DiD-positive cells was determined by flow cytometry using DiOC6 staining (B) Autologous primary patient-derived melanoma cells and TILs were co-cultured at E:T ratio 2:1 and treated with 1 μg/mL anti-PD-L1:TRAIL, anti-EpCAM:TRAIL or 4 μg/mL mAb PD-L1 for 48 h. IFNγ levels in culture supernatant were determined by ELISA. (C) Primary patient-derived melanoma and appendix carcinoma cells were co-cultured with autologous TILs at E:T ratio 2:1 and treated with 1 μg/mL anti-PD-L1:TRAIL for 48 h, after which apoptosis was assessed by Annexin-V staining. (D) DiD-labeled A2058 cells were co-cultured with PBMCs at E:T ratio 5:1 in the presence of agonistic CD3 mAb (0.5 μg/mL). Cells were co-treated with 500 ng/mL anti-PD-L1:TRAIL or anti-EpCAM:TRAIL, where indicated cells were co-treated with TRAIL-neutralizing antibody (1 ug/mL). After 48 h, apoptosis in DiD-positive cells was determined by flow cytometry using DiOC6 staining. (E) In mixed cultures of PBMCs and A2058 as described in D, the PBMC population was stained with fluorescent CD4 and CD8 antibodies whereupon the number of CD4+ and CD8+ T cells within the PBMC gate was analyzed by flow cytometry. (F) DiD-labeled A2058 cells were co-cultured with isolated CD3+ T-cells at E:T ratio 5:1 in the presence of CD3/CD28 beads at a bead-to-cell ratio of 1:10. Cells were co-treated with 500 ng/mL anti-PD-L1:TRAIL or anti-EpCAM:TRAIL and after 48 h, apoptosis in DiD-positive cells was determined by flow cytometry using DiOC6 staining. (G) IFNγ levels in culture supernatant of F were determined by ELISA. (H) DLD-1 cells were pre-seeded 24 h before PBMCs were added at indicated E:T ratio's in the presence of anti-EpCAM:anti-CD3 (50 ng/mL) with or without 500 ng/mL anti-PD-L1:TRAIL or anti-MCSP-TRAIL. Cell viability was determined by MTS after 24 h. (I) IFNγ levels in culture supernatant of H were determined by ELISA. All graphs represent mean ± SD. Statistical analysis was performed using two-way ANOVA (A), one-way ANOVA (D) or unpaired two-sided Student t test (B, F) (*p < 0.05, **p < 0.01, ***p < 0.001, n.s. not significant).

Figure 4. IFNγ upregulates PD-L1 expression and sensitizes cancer cells to TRAIL-mediated apoptosis. (A) Primary patient-derived melanoma cells were treated with or without 20 ng/mL IFNγ for 24 h after which PD-L1 expression was analyzed by flow cytometry. (B) Seven cancer cell lines and nine primary patient-derived melanoma cell cultures were treated with or without 20 ng/mL IFNγ for 24 h after which PD-L1 expression was analyzed by flow cytometry. Fold increase was calculated compared to non-treated cells. (C) IFNγ pre-treated or non-treated DLD-1 cells were incubated with an increasing dose of anti-EpCAM:TRAIL for 18 h, after which apoptosis was assessed by flow cytometry using Annexin-V staining. (D) IFNγ pre-treated or non-treated A2058 cells were incubated with an increasing dose of anti-PD-L1:TRAIL. Apoptosis was assessed by Annexin-V staining after 18 h. (E) IFNγ pre-treated or non-treated A2058 cells were incubated with 500 ng/mL anti-PD-L1:TRAIL in the presence or absence of PD-L1 blocking mAb (10 µg/mL). Apoptosis was determined by Annexin-V staining after 18 h. (F) A small panel of cancer cell lines were pre-treated with or without IFNγ (20 ng/mL), followed by treatment of anti-PD-L1:TRAIL (500 ng/mL) for additional 18 h. Apoptosis was determined by Annexin-V staining. (G) IFNγ pre-treated primary patient-derived melanoma cultures were treated with 1 μg/mL anti-PD-L1:TRAIL or anti-EpCAM:TRAIL for 48 h. Apoptosis was determined using Annexin-V. (H) DLD-1 cells were treated with or without 20 ng/mL IFNγ in the presence or absence of 8 µg/mL IFN-y neutralizing mAb. After 24 h, PD-L1 expression was analyzed by flow cytometry. (I) DLD-1 cells were pre-treated with or without 20 ng/mL IFNγ in the presence or absence of 8 µg/mL IFNγ neutralizing mAb. After 24 h, cells were treated with anti-PD-L1:TRAIL (250 ng/mL) in the presence or absence of PD-L1 blocking mAb (10 µg/mL), anti-EpCAM:TRAIL (250 ng/mL) or mAb PD-L1 (1 μg/mL). All graphs represent mean±SD. Statistical analysis was performed using two-way ANOVA (F) or Wilcoxon matched pairs test (G) (*p < 0.05, **p < 0.01, ***p < 0.001, n.s. not significant).
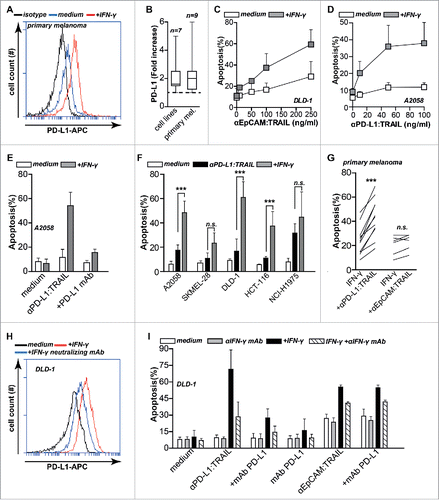
Figure 4. IFNγ upregulates PD-L1 expression and sensitizes cancer cells to TRAIL-mediated apoptosis. (A) Primary patient-derived melanoma cells were treated with or without 20 ng/mL IFNγ for 24 h after which PD-L1 expression was analyzed by flow cytometry. (B) Seven cancer cell lines and nine primary patient-derived melanoma cell cultures were treated with or without 20 ng/mL IFNγ for 24 h after which PD-L1 expression was analyzed by flow cytometry. Fold increase was calculated compared to non-treated cells. (C) IFNγ pre-treated or non-treated DLD-1 cells were incubated with an increasing dose of anti-EpCAM:TRAIL for 18 h, after which apoptosis was assessed by flow cytometry using Annexin-V staining. (D) IFNγ pre-treated or non-treated A2058 cells were incubated with an increasing dose of anti-PD-L1:TRAIL. Apoptosis was assessed by Annexin-V staining after 18 h. (E) IFNγ pre-treated or non-treated A2058 cells were incubated with 500 ng/mL anti-PD-L1:TRAIL in the presence or absence of PD-L1 blocking mAb (10 µg/mL). Apoptosis was determined by Annexin-V staining after 18 h. (F) A small panel of cancer cell lines were pre-treated with or without IFNγ (20 ng/mL), followed by treatment of anti-PD-L1:TRAIL (500 ng/mL) for additional 18 h. Apoptosis was determined by Annexin-V staining. (G) IFNγ pre-treated primary patient-derived melanoma cultures were treated with 1 μg/mL anti-PD-L1:TRAIL or anti-EpCAM:TRAIL for 48 h. Apoptosis was determined using Annexin-V. (H) DLD-1 cells were treated with or without 20 ng/mL IFNγ in the presence or absence of 8 µg/mL IFN-y neutralizing mAb. After 24 h, PD-L1 expression was analyzed by flow cytometry. (I) DLD-1 cells were pre-treated with or without 20 ng/mL IFNγ in the presence or absence of 8 µg/mL IFNγ neutralizing mAb. After 24 h, cells were treated with anti-PD-L1:TRAIL (250 ng/mL) in the presence or absence of PD-L1 blocking mAb (10 µg/mL), anti-EpCAM:TRAIL (250 ng/mL) or mAb PD-L1 (1 μg/mL). All graphs represent mean±SD. Statistical analysis was performed using two-way ANOVA (F) or Wilcoxon matched pairs test (G) (*p < 0.05, **p < 0.01, ***p < 0.001, n.s. not significant).

Figure 5. Anti-PD-L1:TRAIL converts PD-L1-expressing myeloid cells into pro-apoptotic tumoricidal effector cells. (A) PD-L1 expression levels of monocytes, M0, M1, M2 macrophages, immature and mature DCs were determined by flow cytometry. Isotype control MFI was subtracted from original MFI. (B) Monocytes were treated with or without 20 ng/mL IFNγ for 24 h after which PD-L1 expression was analyzed by flow cytometry. (C) Monocytes were pre-treated with or without 20 ng/mL IFNγ for 24 h, washed twice with PBS after which DLD-1 cells were added at E:T ratio 4:1 in the presence of an increasing dose of anti-PD-L1:TRAIL. After 18 h, apoptosis was assessed by Annexin-V staining. (D) As in C with 500 ng/mL anti-PD-L1:TRAIL with or without PD-L1 blocking mAb (10 µg/mL). (E) M0, M1 or M2 macrophages were co-cultured with DLD-1 cells at E:T ratio 4:1 in the presence of 500 ng/mL anti-PD-L1:TRAIL with or without PD-L1-blocking mAb (10 µg/mL). After 18 h, apoptosis was assessed by Annexin-V staining. (F) Immature or mature DCs were co-cultured with DLD-1 cells at E:T ratio 4:1 in the presence of 500 ng/mL anti-PD-L1:TRAIL with or without PD-L1-blocking mAb (10 µg/mL). After 18 h, apoptosis was assessed by Annexin-V staining. All graphs represent mean ± SD. Statistical analysis was performed using two-way ANOVA (*p < 0.05, **p < 0.01, ***p < 0.001, n.s. not significant).
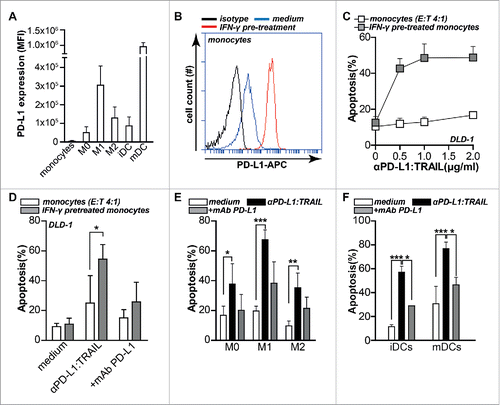
Figure 5. Anti-PD-L1:TRAIL converts PD-L1-expressing myeloid cells into pro-apoptotic tumoricidal effector cells. (A) PD-L1 expression levels of monocytes, M0, M1, M2 macrophages, immature and mature DCs were determined by flow cytometry. Isotype control MFI was subtracted from original MFI. (B) Monocytes were treated with or without 20 ng/mL IFNγ for 24 h after which PD-L1 expression was analyzed by flow cytometry. (C) Monocytes were pre-treated with or without 20 ng/mL IFNγ for 24 h, washed twice with PBS after which DLD-1 cells were added at E:T ratio 4:1 in the presence of an increasing dose of anti-PD-L1:TRAIL. After 18 h, apoptosis was assessed by Annexin-V staining. (D) As in C with 500 ng/mL anti-PD-L1:TRAIL with or without PD-L1 blocking mAb (10 µg/mL). (E) M0, M1 or M2 macrophages were co-cultured with DLD-1 cells at E:T ratio 4:1 in the presence of 500 ng/mL anti-PD-L1:TRAIL with or without PD-L1-blocking mAb (10 µg/mL). After 18 h, apoptosis was assessed by Annexin-V staining. (F) Immature or mature DCs were co-cultured with DLD-1 cells at E:T ratio 4:1 in the presence of 500 ng/mL anti-PD-L1:TRAIL with or without PD-L1-blocking mAb (10 µg/mL). After 18 h, apoptosis was assessed by Annexin-V staining. All graphs represent mean ± SD. Statistical analysis was performed using two-way ANOVA (*p < 0.05, **p < 0.01, ***p < 0.001, n.s. not significant).

Figure 6. Proposed mechanism of action for anti-PD-L1:TRAIL. anti-PD-L1:TRAIL induces TRAIL-mediated cancer cell death after binding to tumor-expressed PD-L1 (1) or after binding to PD-L1 on myeloid effector cells (2), restores proliferation and antitumor activity of T cells by blocking PD-L1/PD-1 interaction (3) and enhances IFNγ production of T cells, leading to simultaneous PD-L1 upregulation and sensitization of cancer cells to TRAIL (4).
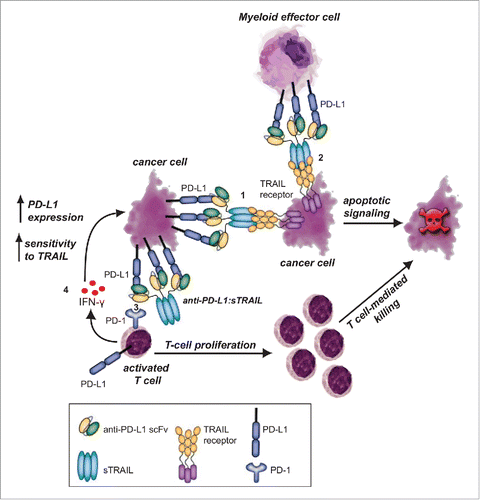
Figure 6. Proposed mechanism of action for anti-PD-L1:TRAIL. anti-PD-L1:TRAIL induces TRAIL-mediated cancer cell death after binding to tumor-expressed PD-L1 (1) or after binding to PD-L1 on myeloid effector cells (2), restores proliferation and antitumor activity of T cells by blocking PD-L1/PD-1 interaction (3) and enhances IFNγ production of T cells, leading to simultaneous PD-L1 upregulation and sensitization of cancer cells to TRAIL (4).
Supplemental material

KONI_A_1202390_supplementary_materials.zip

Download Zip (694.5 KB)